Article Summary (TL;DR)
✅ Use Gorilla ROI to automate repetitive tasks like tracking daily sales and inventory management. Replace time-consuming processes with single spreadsheet formulas.
✅ Utilize Gorilla ROI’s sales template to create custom dashboards. Access detailed sales reports over multiple time periods effortlessly. Gain deeper insights into sales trends and SKU performance.
✅ Simplify inventory monitoring by auto-importing data into Google Sheets. Track inventory levels and prevent stockouts with ease.
With so many processes that you perform in your FBA Amazon business, here are 5 ways to speed up and improve business overall using Gorilla ROI in your workflow.
The goal is to automate, eliminate or simplify the existing processes that occur repetitively throughout your FBA Amazon business.
For some of our past ideas, you should check out:
1. Tracking daily units sold
Time and money-wasting process:
- Seller central
- Reports
- Set the date period
- Download report for the past two weeks
- Update the date period
- Download report for another previous period
- Combine CSV reports into one file
- Create pivot table
- Get the results
New efficient process:
- Enter a single formula to load historical daily sales
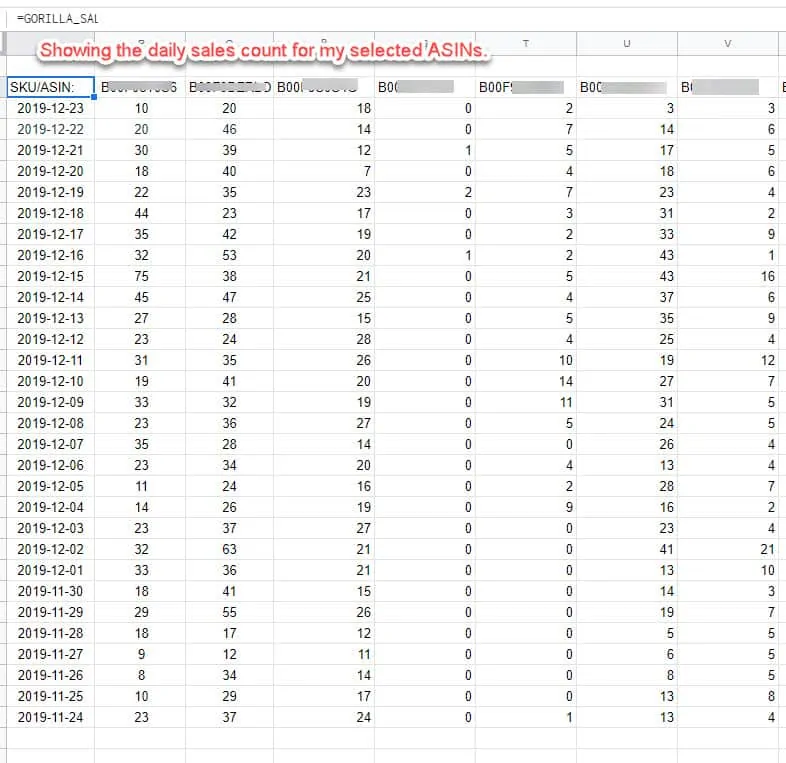
One of the most popular ways of using Gorilla ROI is to track your daily sales via the units sold or the dollar value.
It’s such a basic requirement that Amazon does not provide within Seller Central. There’s no way to look at all your ASINs immediately know the total number of units sold on a per-day basis.
With Gorilla ROI, you can do something like this with a single spreadsheet formula. Dates on the side, each ASIN up top.
Normally you have to download multiple reports because Amazon won’t let you download all the data in a single file.
Then you have to combine all the csv reports and create a pivot table to get the same thing Gorilla ROI does for you in 3 seconds.
2. Improve your Amazon FBA business sales performance dashboard
Time and money-wasting process:
- Log in to seller central
- Go to business reports
- Go to sales reports
- Update the custom date range for each period you want to look at
- Download the report
- Do the same thing for another period
- Open up both files in excel and review
New efficient process:
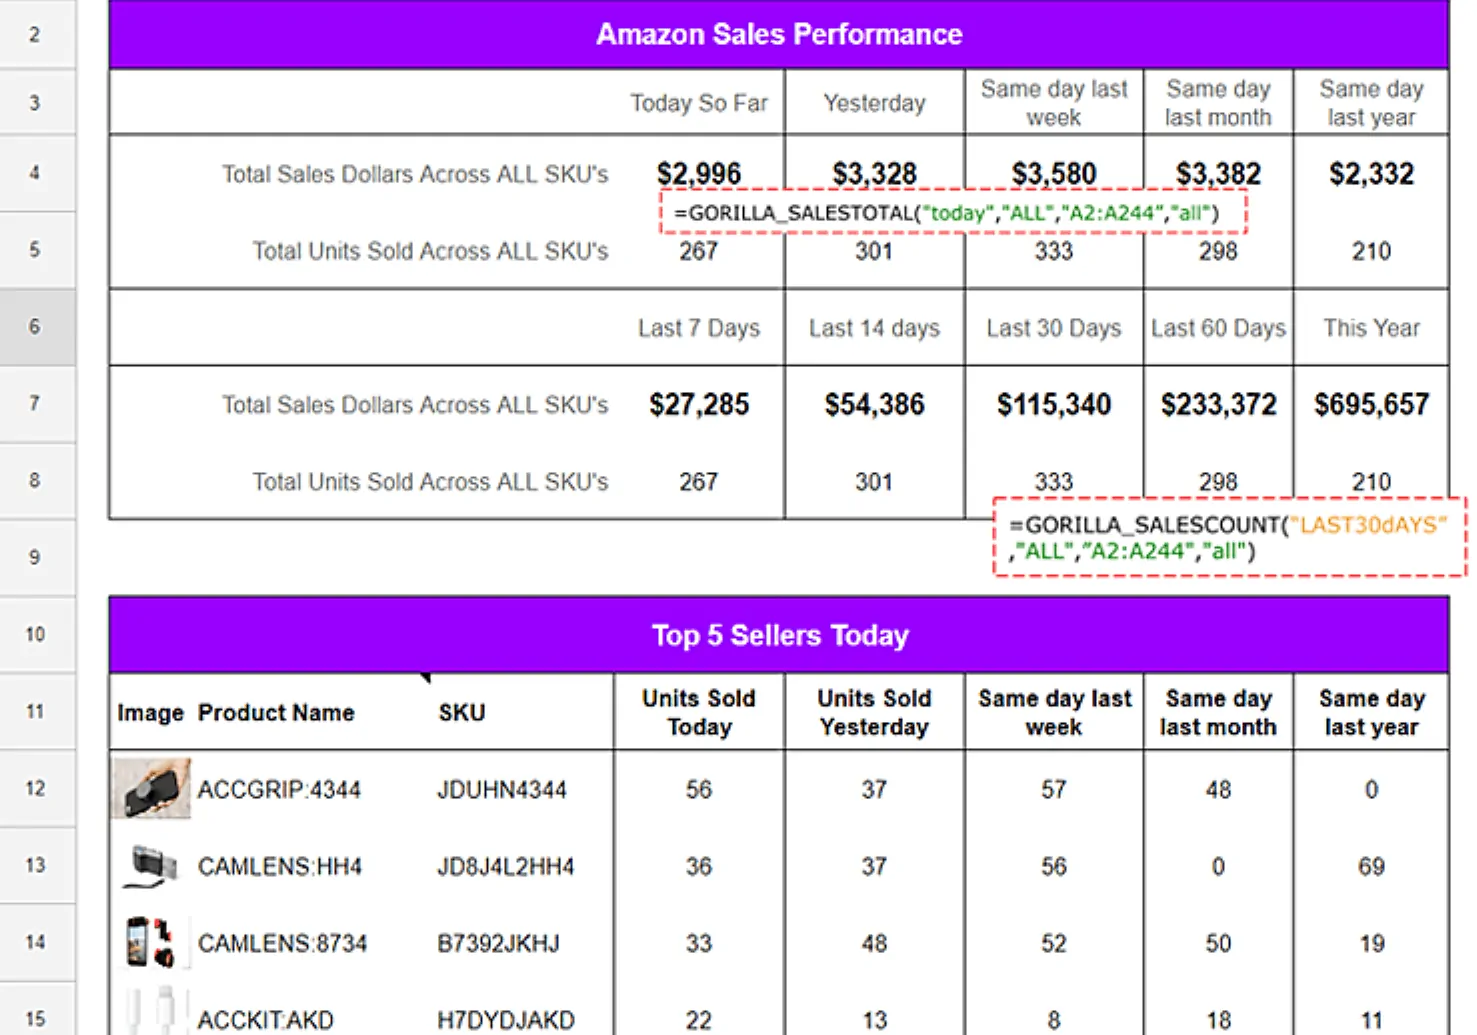
- Use the freely included sales template to get immediate sales reports over multiple time period. Use formula SALESCOUNT, SALESTOTAL, SALESCOUNTHIST, SALESTOTALHIST.
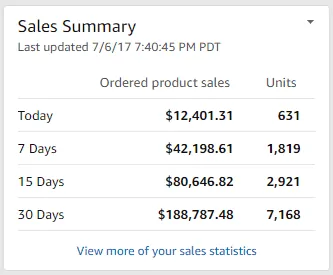
Amazon gives you basic sales numbers for the last 7, 14 and 30 days. It’s good for a feel-good glance but doesn’t provide you with any detailed information about your FBA business.
If you want to get deeper into the numbers, you have to go into your sales and traffic reports and then update the date range each and every time.
Then you have to download the file each time you want to compare it with another period.
This is where your custom sales dashboards in Google Sheets comes in handy to give you a better picture and trend of how your sales are doing.
Currently, you’re used to looking at the most basic sales summary from seller central.
But what this doesn’t show is how you are doing compared to previous and different time periods. It also doesn’t show which of your SKUs are doing well.
Turn the above box into something like the following where you can see how you did in the same day last year, this year and even quickly see which products are performing well.
Sharing a spreadsheet with people is also much easier and safer than making seller central accounts for everyone or sharing accounts among employees.
Other free Amazon FBA spreadsheets are available for download.
If you use sign up to GorillaROI, you get a suite of free ready to go spreadsheets like the one above as part of the membership.
3. Simplify inventory management system
Time and money-wasting process:
- Go to seller central
- Go to manage inventory to check alerts, inbound status, transfers
- Go to inventory planning to review days in stock, restock inventory recommendations
- Inform fulfillment team via email, manual spreadsheet, audio chat or phone
- High potential of going out of stock
New efficient process:
- Auto import inventory data and units sold in a Google sheet
- Track your numbers and prevent going out of stock from a single spreadsheet without requiring 10’s of clicks to get simple data
- Share the spreadsheet and delegate to the fulfillment team to maintain inventory levels
Amazon provides inventory replenishment recommendations but their numbers and pages are all over the place.
You have to go to the manage inventory page to see the number of units that are currently available, inbound and being transferred.
Then you have to go to the inventory planning page to get a summary, followed by visiting the restock inventory page to get an estimate of what products to send into the fulfillment centers.
So much work for a single data point.
That’s not the end though.
To find the velocity of sales per SKU, you have to download reports from different time ranges and combine them to get a value.
This is a lot of work and eats up a lot of time. If you are doing this daily, or even 2-3 times a week, save yourself hours of work by simplifying and automating the process.
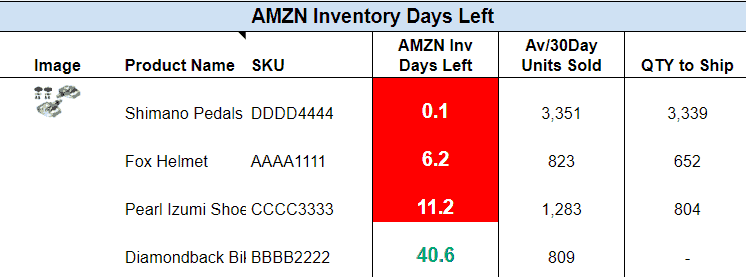
One of our most used spreadsheet templates is the inventory management sheet that helps you keep product in stock as well as planning. It gives you a complete picture of your inventory and sales by SKU or ASIN.
This means you have all the important pieces of information loaded in a single spreadsheet that updates itself automatically.
This is an example of what you can do. It’s so easy to know what needs to be sent, and how many units.
A detailed tutorial to pull inventory data is here.
🗣️ Pro Tip: You can automatically load this type of information and create your own custom dashboard, tables or simply feed the data into your existing spreadsheets.
4. Record daily historical inventory to learn your seasonality
Time and money-wasting process:
- Go to seller central
- Go to manage inventory
- Click the arrow to expand the status of the product inventory
- Manually copy the data into your spreadsheet
- Do it for every sku you sell
- (miss a day and you’ve got gaps in your data already)
New efficient process:
- Enter a single formula using INVENTORYHIST()
One thing I’ve learned related to historical inventory is that sellers want to know when they went out of stock to learn about their seasonality.
Because every product is different, keeping track of inventory throughout the past by day, weeks, months helps the sellers to get more insight into their FBA Amazon business to plan for inventory.
The hard part is that it’s a massive chore to write down the dates and number of units remaining in stock for every sku, each and every day.
If you have 5 skus, then it’s possible. If you have 100, it’s a nightmare. Not worth the effort and errors.
By loading historical daily inventory numbers using our Gorilla_InventoryHist() function, you can load your historical inventory units and prevent your operations from going out of stock.
An example is the screenshot below where I can filter for inventory in “transfer” process from this week for any sku I’ve selected.
No clicking around searching for information. No compiling spreadsheets.
5. Review management and respond faster to complaints
Time and money-wasting process:
- Go to seller central
- Go to the product page
- Click around for the reviews
- Sort for negatives
- Repeat for all products
New efficient process:
- Use software that curates it all in one place using REVIEW formulas.
There are tons of Amazon review management and emailing software.
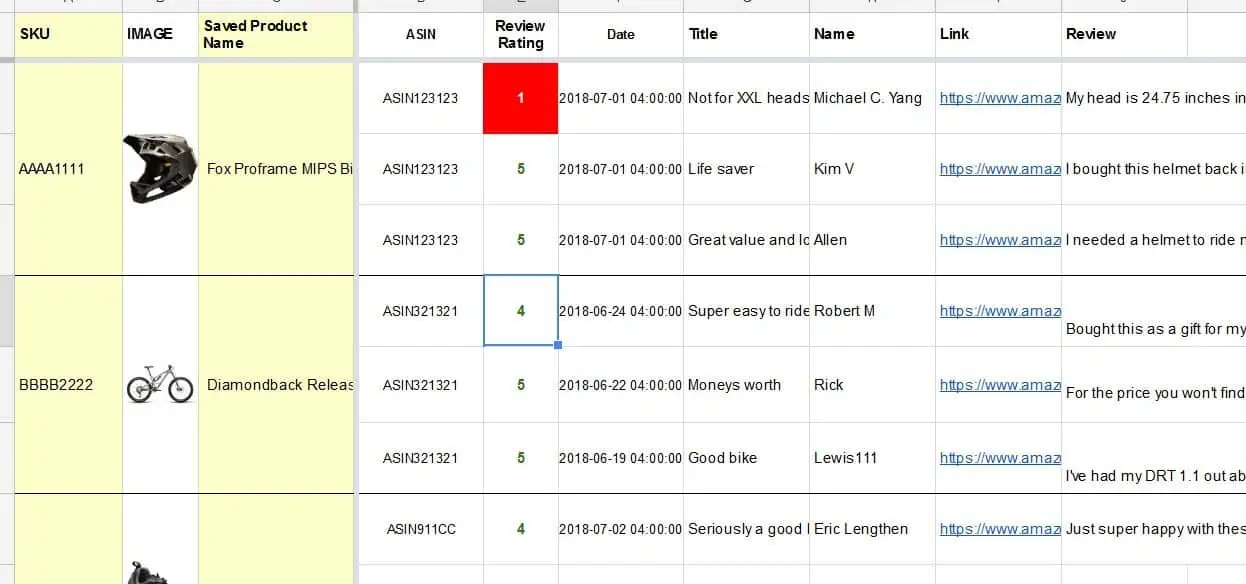
With Gorilla ROI, we’ve taken a different approach where you can pull reviews for any of your child ASINs directly into a spreadsheet.
This makes it easy to share and discuss. You can copy the data into an email and send it to the customer service team to review, you can pull a list of the last 50 reviews or drill down to a single SKU.
Rather than hunting to find the data, create your own dashboard to monitor customer service and reactions.
There is a ready to use review management spreadsheets available as soon as you sign up.
Bonus: Simplify data sharing across teams
One thing that we’ve changed is how data is handled across our business.
We no longer create new accounts for employees. Accounts are only created for people whose job requires it.
- Me – Full access
- Operations assistant manager – 90% access
- Operations assistant – 70% access
- Bookkeeper – 50% access
- Automation only account – 90% access
That’s about it.
This way, data is protected and people are not logging in and out without reason. The goal is to limit people touching the account as much as possible. Only for those that need to.
We changed to this because after reviewing our systems, even the people who accessed seller central used it for their own single purpose.
- Founders only visited the sales report
- Fulfillment only inventory pages
- Bookkeeper only downloads the finance csv’s
Even the bulk of the work performed by myself and our operations team centered on reviewing listing details and other pages weren’t visited as frequently.
These lesser-visited pages added more work and crowded mind space of another thing to check at intervals.
Now, our system is simple and looks like this:
- A single master spreadsheet controlled by the operations team pulls in all required data
- Sales data is then imported into a separate sales performance spreadsheet. Nothing else.
- Inventory data is imported into a spreadsheet that the warehouse team can access.
- Bookkeeper still has to log in and export the full files, but a lot of the financial data is pulled and reviewed via our finances spreadsheet.
- Data we need to share with customers or suppliers and loaded into a basic non-sensitive format.
By doing this, we “silo” the data. It keeps our Amazon data protected and our teams actually end up with more data in a single spreadsheet on their computers.
All they do is refresh to pull in the latest data and get straight into making decisions.
No more meetings about what has been done, what needs to be done, who is doing what etc.
It also speeds things up and if your website is slow, then you need a speed booster to get it running quickly and efficiently.
Summing up
Amazon has shown you the possibilities of utilizing software and systems to create a healthy and scalable business.
It’s no different in your own operations. The more you can automate and simplify your processes, the easier it is to scale.
Rather than bog yourself down in day-to-day activities, review the way you handle tasks step by step and work to eliminate 50-75% of those steps.
You’ll be surprised by how much fat you can cut out.
All the savings will materialize in your bottom line.
If you aren’t using Gorilla ROI or other software to operate efficiently, determine your processes first, then determine what your needs are and find a solution to help you implement the steps.
Comments
Related Posts

10 Profitable Product Categories for Amazon Affiliates 2025
What you’ll learn Amazon is a favorite for experienced and…

Unlock the Secret to a Profitable Automated Amazon Store: How to Build a Hands-Free Income Stream
Ever dreamed of running a profitable Amazon business while sipping…

Master Amazon New Restricted Keywords: A Seller’s Guide to Success
Changes to Amazon’s restricted keywords list have taken a lot…




Leave a Reply