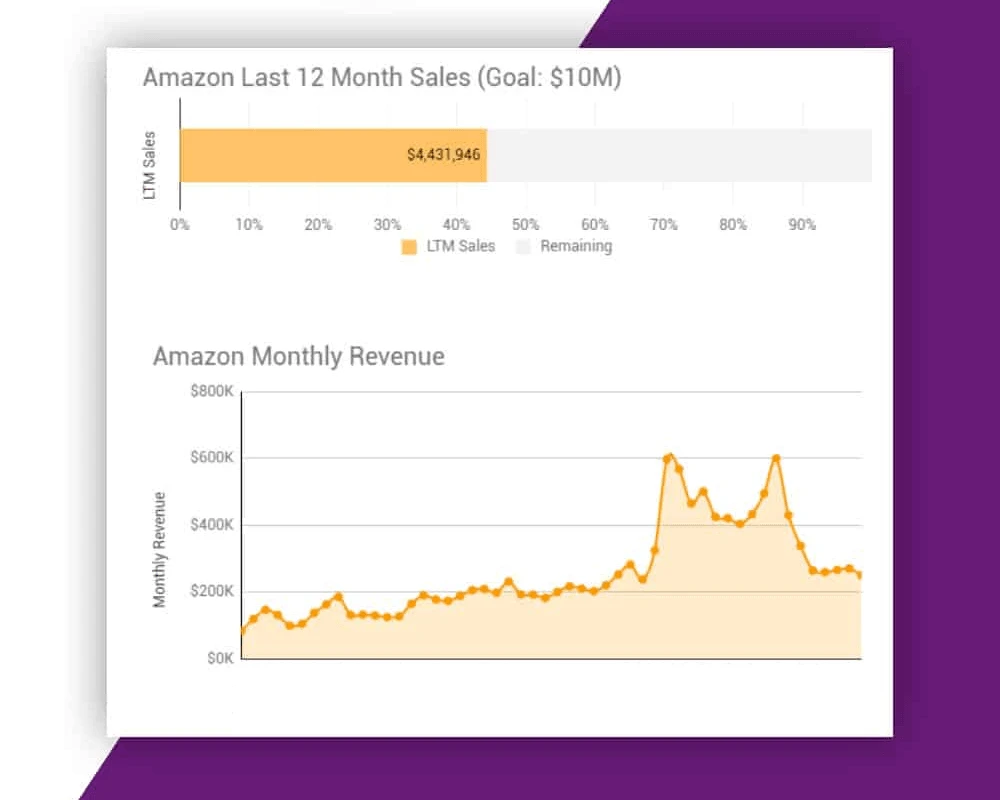
Here’s the current Gorilla ROI Amazon sales progress. To see the interactive version, go to our income reports page.
Note: These monthly updates are for educational purposes only.
Article Summary (TL;DR)
✅ Explore the performance metrics and milestones achieved in August for our FBA business, reaching $250K in sales.
✅ Gain insights into the challenges faced and lessons learned during the month, highlighting opportunities for improvement and future growth.
✅ Learn about the strategies implemented to drive sales growth, including inventory management, pricing optimization, and marketing efforts.
August is in the books. I’ll break down what’s been going on with our Amazon business and what I’m seeing on the horizon.
- August summary
- New metric added: Session Value
- Handling rising costs
- New Amazon revenue forecaster calculator
First, the numbers as usual.
August stats
- $250k in sales.
- Down vs last year.
- Down vs last month.
- -41% down from the same month last year
- -7.4% down from the previous month
- Conversion rate increased to 31.8% vs 30.4% the previous month
- Session value increased to $5.27 (sales ÷ sessions) vs $5.16 last month
- ACoS decreased to 34.7%.
- TACoS decreased to 17.5%.
Things are looking brighter compared to what I’ve been sharing the past few months.
Although the numbers look down by a lot, considering I was down -54% compared to last year earlier in the year, gaining ground by 13% is a positive development.
August, September, October are typically our slowest months as summer dwindles down to its final days and people are busy enjoying the outdoors rather than staying cooped up in their homes, cleaning.
When put into context, it makes the numbers better and an indicator that we are on the right path.
That’s where session value comes into play. Super easy metric but very useful to value a session. My session value of $5.27 simply means that each time a new person visits a listing, it becomes $5.27 in sales.
You can use this number to calculate your budget for off Amazon advertising. If you know that each person that looks at your listing is worth $5.27, you can afford to spend a few dollars to get someone from Facebook or Instagram, or TikTok to your listing.
You can also use Session Value to track the quality of the sessions. If sessions increase but the sales don’t go up with it, then people are not buying, not converting.
Try it out yourself.
Go to business reports > sales and traffic > change to monthly view and calculate sales divided by sessions for each month and see what your trends are like.
How are you handling rising costs?
I keep up with supply chain news when I can, but most of my decisions are shaped by what I see and do every day rather than relying on the media.
I was re-reading my report from February and here’s what I wrote.
I don’t see this improving anytime soon.
If you have the cash, I suggest you start ordering 2x the amount of 2x more frequently because it’s only going to get worse. With leadtimes at current levels, you have to put orders in June to get Q4 or 2022 Q1 products.
This piece from freightwaves raises some interesting points.
- People responding to a survey have “the expectations of continued transportation price increases for the next 12 months remain very strong.”
- “We have a situation in tight capacity across all aspects of the supply chain combined with firms frantically attempting to build up inventories to avoid shipping-related stockouts during Q4,” the report added. The combination is “driving prices up exponentially.”
- “The rapid increase in container prices seems to suggest that supply chains have reached an inflection point in which the strain on capacity is now leading to sharp price increases which will eventually lead to a market correction in the form of significantly increased capacity. The key question firms now face is what to do while we wait for that additional capacity to come online?”
I too expect price increases for the next 12 – 18 months at a minimum.
We too are building up stock so as not to go out of stock in Q4. In fact, I’m aggressively building up inventory of our core products. If we go out of stock on those items, we are in big trouble.
The problem with this is that you need a large cash hoard to get you through, survive a longer cash conversion cycle, and then be able to reorder another huge amount before the inventory is drawn down.
We just received a shipment from Vietnam and when I originally submitted the PO, container prices were around the $5k mark.
These are fairly large items so I’m not getting a million widgets in a 40ft container where I can spread out the cost.
But my bill comes out to be $15k. Three times higher than I had estimated. This ballooned by my landed cost from the original $9 to $18. And for a particular SKU, I’m at a point where it’s a lose-lose-lose.
- No one will buy if I try to sell the item at $60-70
- I lose money if I sell via FBA
- I lose money if I sell via FBM or direct online
The only way is to try and break even, take a minimal loss, or peddle it on craigslist or offerup.
For the most part, I’ve absorbed the high container and transportation prices, but it definitely looks like prices will have to rise across the board.
How are you handling the rising costs?
Taking it yourself? Not affected? Passing it down?
Identifying and tackling tasks that make a big impact in our business
The fun part about supply chain management and Amazon inventory management are the unexpected challenges that pop up and coming up with creative solutions to solve them.
The better you are at identifying, forecasting, modeling, and solving them, the bigger your advantage versus the competition.
But if you are like me and get slammed with so many things, it feels like I don’t get anything done.
After I wrote the monster listing optimization guide, I’m reminded that there are only 6 levers to pull that impact any FBA business.
- Sessions
- Order Item Session % (conversion rate)
- AVG Sales per Order
- Product COGS
- Amazon PPC
- Business Expenses
Everything you do ends up in one of the categories above.
And as I think more about the 80/20 rule of what my team can do to have the biggest impact, we created a Amazon revenue calculator and forecaster.
This calculator allows me to play around with each of the different levers and think about different scenarios, think about what we should be doing as well as what we shouldn’t be doing.
Each company has its strengths and weaknesses. Some kick-ass at marketing but suck at operations. Some are rockstars with product development but weak with SEO.
For us, our company is awesome at operations, but not the best at marketing. With this in mind, if I had to focus on one of the 6 categories, working to increase sessions doesn’t jump out as our best strength.
Increasing sessions would mean driving more traffic to your existing listings, or creating more products and getting traffic to the new listings, and kicking ass on the launches.
Not our strength.
On the other hand, I know that improving conversion rates is right up our alley and we definitely can improve our sales per order.
What I find is that all the tools related to Amazon are focused on researching and whether an ASIN will be profitable. But as a business operator, these calculators don’t help me steer the entire business in the right direction.
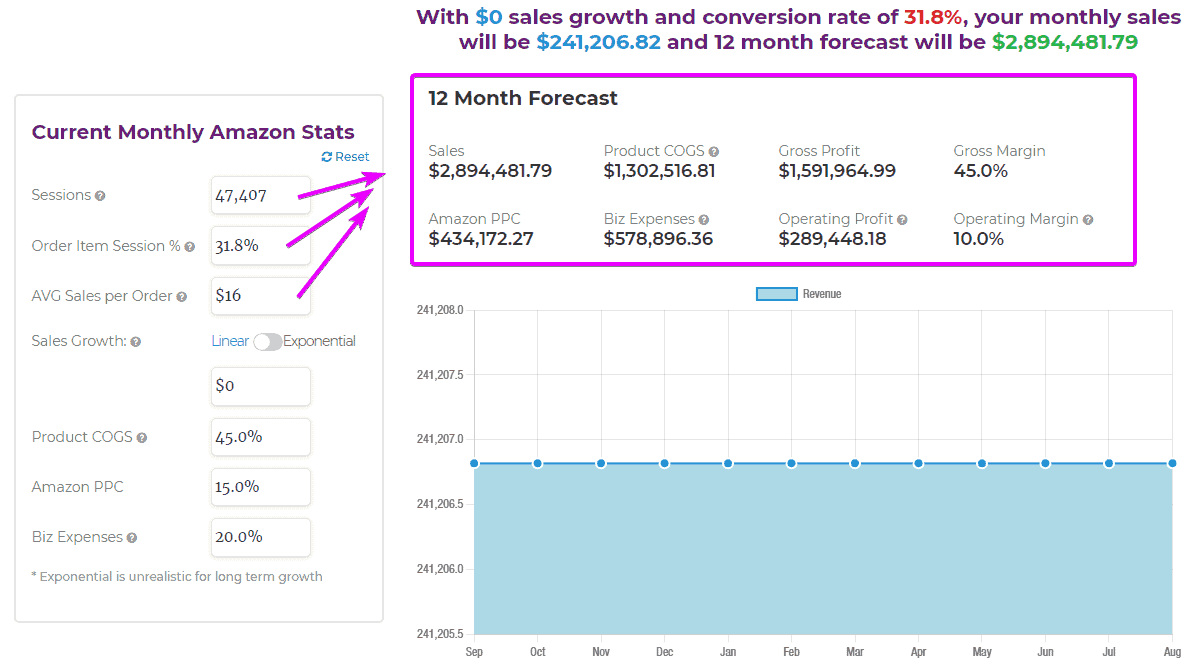
With this revenue forecaster, I can plug in the basic stats from the business reports and get a good idea of what it will take us to get from $4M to $10M.
E.g. removing background images is not going to take us to the next level.
Here’s a scenario that works for us.
In August:
- sessions = 47,407
- order item session % = 31.8%
- avg sales value = $16
Assuming we don’t grow at all, this is what it will look like at the end of 12 months which is very close to what we are doing now.

Now if the only change in our business in the next 12 months is to increase the order value from $16 to $17, take a look at what this one change can do.

The monthly sales will jump from $241k to $256k. A 6.2% increase in monthly sales from a $1 increase in order value.
Now if my goal is to raise $1 across the board, the questions I need to ask myself are:
- when was the last time I’ve reviewed my pricing?
- what products can be increased by $1 or more?
- what bad-performing cheap SKUs can be discontinued?
- what SKUs can go through additional cost-cutting?
- how can I increase the perceived value of existing listings?
A single tweak showing you how it impacts your business gives a clear direction of how your business can improve as a whole. Low hanging fruit in front of eyes that you’ve been missing.
You can use the calculator on a per SKU basis following the same logic. Enter the sessions of the SKU, conversion rate, order value. Then play with different assumptions and see what can really move the needle and amplify your SKU and business.
Check out the Amazon revenue calculator.
My team and I are looking to create more calculators like this. Have an idea for one? Drop them in the comment section below.
NEW Gorilla features

Two new functions have been created. Docs and videos haven’t been posted yet, but it’s very easy to use. Literally doesn’t need any inputs to start with.
GORILLA_INBOUNDSHIP(shipmentid, status, count)

EXAMPLE
- GORILLA_INBOUNDSHIP()
- GORILLA_INBOUNDSHIP("FBA12XYZ34", "All", 50)

ABOUT
Dump inbound shipments data.

GORILLA_INVENTORYRESTOCK has been updated to include the additional columns that Amazon added to the reports.
Articles published
- More updates to ULTIMATE Amazon listing optimization guide. Free checklist included.
- Ebook version coming soon that you can share with your team.
Comments
Related Posts
Smart Guide to Import Amazon Data to Google Sheets
Running an Amazon business means juggling dozens of moving parts:…
The ultimate guide to Shopify marketing attribution: what works best for your business?
What you’ll learn Have you ever wondered where your customers…
Top 5 Strategies to Sustainable Shopify Growth: Turning One-Time Buyers into Lifetime Customers
What you’ll learn As a Shopify seller, you’re constantly looking…


Leave a Reply