Article Summary (TL;DR)
✅ Separate data entry (kitchen) from presentation (dining area). This avoids messy sheets and simplifies updates.
✅ Each sheet focuses on a specific task (e.g., product details, calculations). This makes the spreadsheet scalable and easier to manage.
✅ Store raw data in a dedicated sheet. Formulas in other sheets can then reference this central location for updates. This eliminates the need to update formulas in multiple places.
When was the last time you went to a restaurant and was seated in the middle of the kitchen?
Never.
The same concept should be applied when creating spreadsheets and organizing data, yet the most common thing people do is “eat in the kitchen” at a restaurant.
Anyone can do spreadsheets, but not many people can do them right.
And I’m going to share a simple way to organize and create spreadsheets that will make it easier to manage, update, scale and share.
The old way of having all the data, calculations, results and everything else jumbled up in the same sheet should be a thing of the past.
Let’s get right into it.
The restaurant technique to creating spreadsheets
Setting up a spreadsheet is no different than how a restaurant is set up.
A restaurant can be simply divided into two sections.
- The kitchen (back end or data side)
- The dining area (front end or display/user side)
All the magic happens in the kitchen (back end), and it’s either a hot mess or a well-oiled machine. In any case, it’s hectic back there – but that’s ok because it’s where all the raw data and calculations come to life. Not for people to see.
The dining area (front end) is what people see. It should be clean, well laid out and easy to navigate. No one likes cluttered, dirty, dusty tables, plates and menus.
Keep this concept in mind when creating your spreadsheets to analyze data – especially Amazon FBA data as there is a ton of information in there.
Why separation is vital
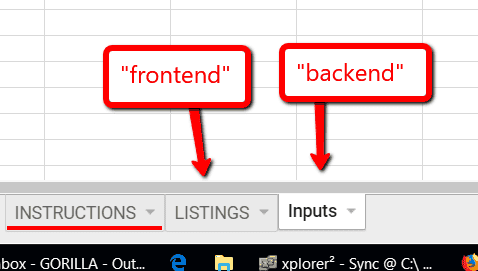
Take a look at the screenshot below of a basic spreadsheet included with Gorilla Sheets Addon.

You’ll see multiple sheets (or tabs) to separate the backend and frontend.
In the inputs tab, information used to plug into formulas are entered here. In our case, things like the number of products, our seller ID and today’s date are stored in a central location.
The formulas then reference the required data point from this tab. Now I don’t have to manually enter the data point into every formula.
Imagine the mess and headache if you enter the product ASIN into 20 different formulas and then have to update it later.
Here’s another example.

In this spreadsheet, I have a total of 4 sheets within the spreadsheet.
- DASHBOARD – front end
- INVENTORY – front end
- product_details – back end
- Inputs – back end
For this spreadsheet, I enter our Amazon FBA product details like SKU, ASIN, UPC, dimensions, weight, units per case and other data. No product information is ever entered outside of this tab.
Inputs sheet is the same as mentioned above where it holds generic but important data like today’s date, seller ID, marketplace ID, counts the number of SKU’s entered into product_details.
The front end dashboard and inventory sheet then pull information from the back end sheets to create a simple and nice looking dashboard.
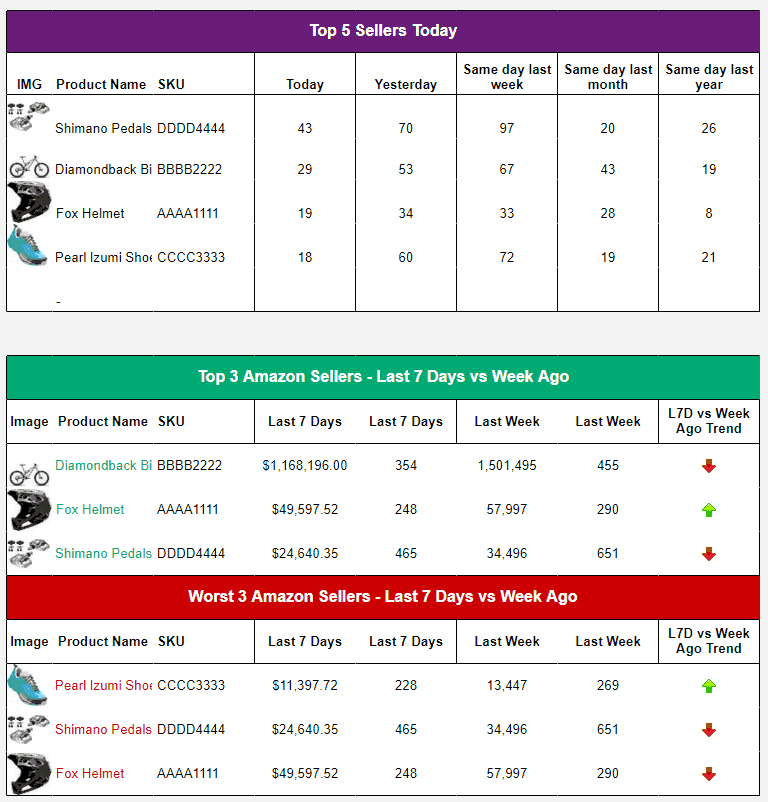
Something like this Amazon FBA sales dashboard.
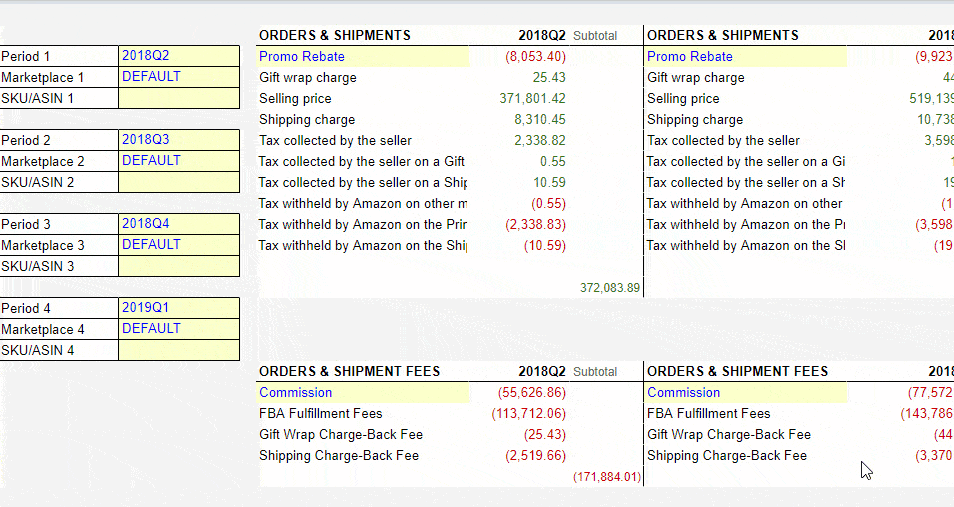
Or how about this Amazon fees and services dashboard that organizes what Amazon charges us.

The last thing I want to do is update the formulas every time I import new data.
As you can see, this simple practice will 10x your productivity and make your life easier.
- It separates the raw data with the rest of the spreadsheet. Changing the raw data will auto update the rest of the spreadsheet. Not in 10 different places scattered throughout the spreadsheet.
- It makes it easy to manage and scale a growing spreadsheet. The data is stored in a consistent and centralized place in your and not scattered everywhere.
- Other people will be able to work on the spreadsheet without messing things up.
- Advanced tip: you can break up the data even further if you have multiple data sources. Feed it into its own tab, and then combine a “master” data sheet by combining the data from the other tabs. You can use QUERY() or VLOOKUP() or FILTER() to consolidate the data into a master tab.
Another example of how it works
To take it one step further, I like to organize my spreadsheets like I’m running a restaurant with multiple line cooks. Each line cook does one part of the big picture. One person does meat, one person does fish, one person does appetizers and so on.
In this way, I set up my spreadsheet where each tab specializes in one area and I split it up into a back end and front end.
If I have a spreadsheet where I have information related to:
- sales
- inventory
- reviews
- product info
I create backend sheets called:
- sales_data
- inventory_data
- reviews_data
- productinfo_data
In my old inventory spreadsheet, I used to house all the inventory data, formulas and final information into the single “inventory” sheet. As more information was added, it became a nightmare to fix and change.
Simple maintenance went from a few minutes to 30 minutes to 1 hour. Then I stopped using it because it was too much of a headache. If I changed something or added more data, it either broke everything or I lost track of all the different cells that needed updating.
Spreadsheets are supposed to help, not to become a hindrance.
Now, I separate inventory by loading all the raw inventory data into inventory_data. This data sheet normally has thousands of data points like
- units in stock
- units in transit
- units sold last 7, 14, 30 days
- units sold 1 year ago, same day last week, same day last year etc
Then on the “inventory” sheet, I can pick and pull what data I need to display by using vlookups, index, or ther forumulas and loading them into the frontend sheet to make it look clean and nice.
Here’s a screenshot of the “inventory_data”.
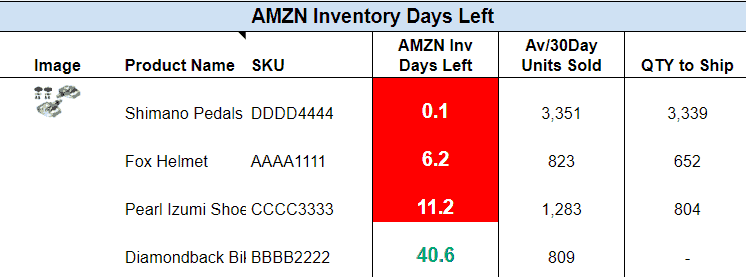
And this data sheet is then used to create my nice and clean “inventory” sheet to track the important data and stats for myself and our team.
You can see what a difference it makes.

By separating and organizing how data is stored and referenced, you can now focus on analyzing the data.
To update the data, all it takes is for us to either bulk copy and paste in one go, or to use GorillaROI addon to auto load and update the data.
How to get data into the “Front end” sheet?
You can pull the data from your raw data section by using plain ol’ Google spreadsheet formulas.
Vlookup() is a classic staple, which I won’t go into here as there are literally thousands of examples on how to use it.
Index() and Match() are under-rated options but very powerful methods. Good examples and explanations in this link.
Importrange() is one of my favorites because it’s so easy and loads quickly.
You can load entire sheets from a different file into your current spreadsheet. If I’m working with a monster spreadsheet, I import multiple different spreadsheets into a single sheet. Here’s the page from Google on how to use it.
Query() is an advanced function that I use to pull and display data directly.
If you look at any of the dashboards for the spreadsheets included with GorillaROI, it’s what I use to quickly build nice looking tables without having to mess with too many vlookups.
There’s nothing complicated about these formulas or this method of creating spreadsheets.
But it does require more “prep” and thought and that’s the biggest hurdle when it comes to making spreadsheets. It’s so easy to start plugging data and calculations anywhere rather than taking 15 minutes to understand what you are trying to do.
Once done right, you’ll be asking why you’ve been doing it any other way.
Free spreadsheets for Amazon sellers
If you don’t want to deal with all the stuff I’m talking about here and just want some templates to edit and work off, I have put a list of free fba Amazon spreadsheet templates for you already.
Follow the link above and you can download spreadsheets for:
- Detail child item sales analysis
- Amazon PPC Customer Search keyword analysis dashboard
- Amazon PPC Targeting Keyword analysis dashboard
- Seller sales performance stats
- Product listings information template
- Sale & traffic analysis dashboard
Combine it with the free Addon to see how powerful it can be.
Comments
Related Posts
Mastering Shopify’s UTMs: The Simple Way to Smarter Marketing
Let’s be honest: marketing your Shopify store without tracking what’s…

10 Profitable Product Categories for Amazon Affiliates 2025
What you’ll learn Amazon is a favorite for experienced and…

Unlock the Secret to a Profitable Automated Amazon Store: How to Build a Hands-Free Income Stream
Ever dreamed of running a profitable Amazon business while sipping…


Leave a Reply