Article Summary (TL;DR)
✅ Explore the features and capabilities of the Gorilla ROI Amazon Sales Analytics Tool for comprehensive sales insights.
✅ Gain access to real-time data on sales performance, revenue trends, and customer behavior to inform strategic decisions.
✅ Leverage advanced analytics and customizable reports to optimize sales strategies, drive growth, and maximize profitability on Amazon.
Is there a way to be successful in any business without knowing and measuring your Key Process Indicators (KPI)?
No, there isn’t and it’s the same with selling on Amazon.
The question is: How do you know what KPI to track? How do you keep an eye on your revenue, your SEO and PPC performance, on your Buy Box winning rate without some sort of Amazon analytics tool?
If you take a closer look at what is out there, you will find a broad spectrum of possible Amazon analytics tools from providers with different features and, of course, different price ranges.
Most Amazon seller tools are based on a web platform. If you are looking for a web based software that is easy to use, the options are endless nowadays.

If you are an advanced seller and lover of Google Sheets where you need access to your seller data in a way that you can manipulate and customize, then Gorilla ROI is the best option as an Amazon connector.
You enter a custom spreadsheet formula and it will pull your seller data directly into Google Sheets.
=GORILLA_ASINLIST()
This formula will load all of the ASINs in your seller central account.
You can then enter a formula as below to get the BUY BOX PRICE of your ASIN into the spreadsheet without having to export or copy and paste. Replace your ASIN with the one in the example of course.
=GORILLA_BUYBOXPRICE("B00YD545CC")
What is the Amazon seller analytics tool?
Profitable sellers on Amazon take advantage of the right kind of analytics software in order to grow their business.
On the flip side, sellers who consider everything as a cost, rather than an investment and a way to speed up their analysis are the ones that don’t do well as sellers.
There is so much data to be assessed that you need help from an analytics tool and why using an Amazon business analytics software will help you understand the data.
From managing your Amazon seller dashboard to generating reports and visuals, sales analytics software offers a wide range of perks.
Downloads Page: Get the FREE Analytics & Reporting Tool and More Spreadsheets
What to look for in an Amazon sales analytics tool?
Before using the Amazon analytics tools, you need to understand what you need to make it effective for your business.
Track your profit quickly and accurately
Keeping track of your profit is necessary. You need to know how much profit you are generating from your sales. Instead of doing it manually, you can get basic stats from the Amazon business reports and analytics. The reports and sales dashboard will offer insights on the sale. But to get the total profit of the sale, you’ll need to:
- export your sales reports
- export your transactions
- export your orders reports
- export your V2 settlement report
and then you can reconcile all the thousands of rows, merge files, create tables, delete hundreds of rows before coming up with a basic number.
On the other hand, with a tool like Gorilla ROI, you can use a formula like this
=GORILLA_PROFITLOSS("2022")
and it will automatically load your 2022 sales and expenses for you to see your profit and loss in less than 10 seconds. A formula with finer control where you can control the marketplace, the time period, and more is what this screenshot shows.

Working with spreadsheets for your profit and loss is just more intuitive and something that everyone is used to. No need to learn new software. Just your favorite spreadsheet that can automatically fetch data.
Check your PPC sales and statistics
With PPC being the number 1 biggest spend on Amazon, it’s super important to track this accurately down to the ASIN level.
Instead of checking this manually, there are lots of PPC software to give you insight into your PPC performance. From per day clicks to the ratio of clicks compared with other PPC ads, the tools help you do things faster.
As PPC is the number one biggest spend for any seller, getting your stats and data right on this is a no brainer. Utlimately, to support your sales analytics, you’ll have to either
- use a software
- do it manually
- outsource to a PPC agency
Here are the pros and cons of each.
PPC Software Pros:
- Saves time because the software pulls in your advertising data
- Can edit and update campaigns directly to Amazon because Amazon’s interface for managing campaigns suck
- Multiple people and users can access
- Can hook up multiple accounts
- Can perform rules based editing and other automation
PPC Software Cons:
- Most software charge a % of your ad spend which gets expensive very quickly
- Many people have found the auto algorithms mess up their campaigns and drastically increase their ACOS
- Automation limitations
In House PPC Manager Pros:
- 100% control
- All data is kept in house
- A dedicated person to act on any trends, issues, ideas
- Easy to strategize and keep things on track
In House PPC Manager Cons:
- Manual work is slow
- Full time position is a high cost per month
- Not 24/7 like software
- Requires a backup person in case the main PPC manager is on leave
Agency PPC Pros:
- PPC experience
- Knows what is working for other clients and can apply those techniques
- Free yourself up
Agency PPC Cons:
- Don’t know how things are done
- Potentially just as expensive an in house PPC manager
- Less time dedicated to your account
- Manual work is slow
Analyzing reviews and review velocity
Amazon reviews is vital to succeed on Amazon. Organic reviews, not fake and black hat reviews, show that your brand is communicating well with the customers. Amazon loves using natural organic reviews to rank brands in their search results. Knowing your stats related to reviews will help you understand your brand and how product launches are going along with your sales.
With Gorilla ROI, you can pull your reviews and ratings per product with a single formula.
This formula will load the last 5 reviews for the ASIN.
=GORILLA_REVIEW("B00YD545CC", "US", 5)
This formula will show you the total ratings an ASIN has received for the UK market.
=GORILLA_RATINGSCOUNT("B00YD545CC", "UK")
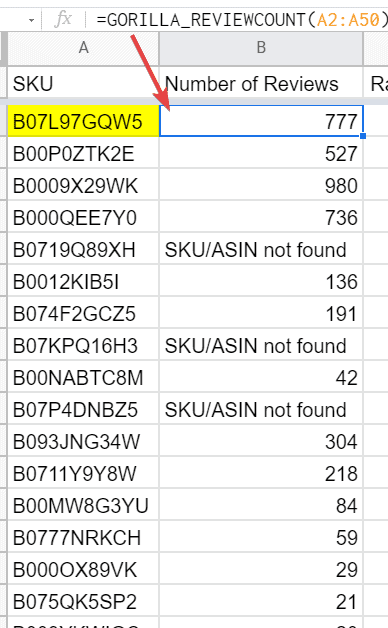
Using the following formula with a spreadsheet range can load the total reviews received in bulk.
=GORILLA_REVIEWCOUNT(A2:A50)
Cost analysis
Cost evaluation is also part of your sales analytics and ties in with profit analysis too.
You can only generate profits if you know your numbers and expenses. That is why using an analytics tool is important instead of doing it by hand which will cause lots of errors. Things to consider for cost analysis.
- FBA seller fees: Working with Amazon using FBA can be easy. However, you need to manage the costs of FBA as well. You certainly don’t want to ruin your profits without estimating FBA. From fulfillment costs, storage costs, chargebacks, adjustments, and the 180+ different charges and seller fees that Amazon will make you pay.
- Promo values: Most analytics tools should be able to give you the amount you are spending on promos. The coupons, discounts, lightning deals and other promos you run on Amazon.
- Freight & shipping costs: We broke down our lead time calculations and showed you the importance freight and shipping. With rising freight costs, it’s vital to factor this in properly to figure out whether a product is profitable enough to keep selling.

- Cost of goods: You’ll need to track this on your own as Amazon doesn’t have your COGS data. From the preparation of the goods to the overall shipment, all costs should be scrutinized.
- Margins: Another important thing that the analytics tools help with is the assessment of margins. For you, the profit margin is the most important thing to know. From sales to orders and revenue, the analytics tools give the best insights on current and estimated margins. The tools also help to predict the margins based on the strategy you want to implement.
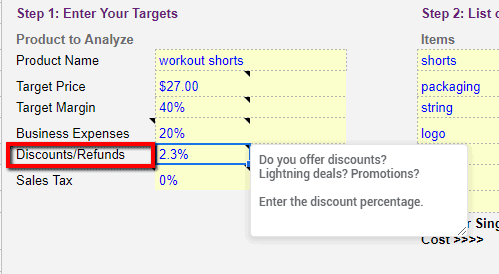
- VAT: The value added tax or VAT is the amount of tax that is placed on the product based on its value. Each country (except the US) has a specific VAT rate already included in the selling price. You need to know the VAT to make sure your final price will be profitable. Using the best Amazon analytics tool will give a complete analysis of VAT.
- Italy VAT is 22%
- Spain VAT is 21%
- Sweden VAT is 25%
- Poland VAT is 23%
- France VAT is 20%
- Each country has a different VAT so when you calculate your profits after tax, you need to factor in VAT to your pricing model. The difference between your true profit could be 20% if you forget to calculate your product with tax involved.
Downloads Page: Get the FREE Analytics & Reporting Tool and More Spreadsheets
What to consider when looking for an Amazon analytics tool
Step 1: Know your business objectives
Every investment should start with outcomes. If you want to improve your Amazon analytics capabilities, that should be done in order to drive specific business objectives. That could be:
- Grow your business by 30%
- Increase profitability by 10%
- Successfully roll out a new product
- Increase market share
- Reduce stock out times
- Know what product to buy more of
- Getting easy and full access to your seller data
These high-level goals will help you deploy the software you eventually pick. But it will also help you hone in on the features that are most important. For example, if you want to increase your market share, look for a tool with sophisticated competitor analysis capabilities. If you want to increase profitability, you should look for a tool that can deliver numbers to you the way you want it to.
We have a free Amazon revenue forecaster where you can enter your current sales data and a growth rate to see where you will be in 12 months at the current rate.
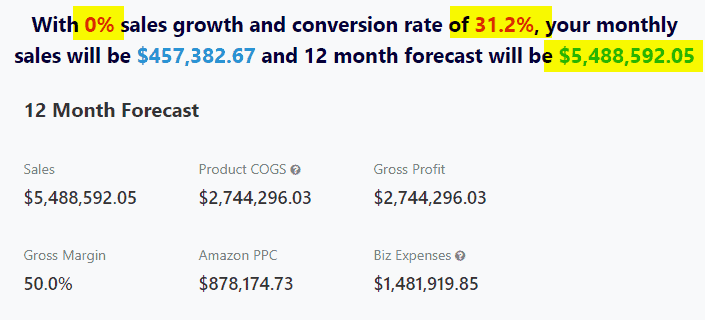
Or if you’re looking to better understand your numbers first, to understand your objectives, you can use our PROFITLOSS function and our Amazon profit calculator spreadsheet to get your financials like this example.
=GORILLA_PROFITLOSS("2022")

This way, you can determine whether it’s fees you need to reduce, sales per SKU you need to analyze, improving margins, inventory turnover to improve, etc.
Step 2: Use what Amazon offers for free
Amazon offers a number of free data reporting and analysis tools. Amazon Seller Central and Vendor Central both offer large amounts of data. There are the Amazon Advertising reports, and data within Amazon Seller Central.
If you qualify and enroll with the Amazon Brand Registry program, Amazon Brand Analytics is free and holds a wealth of data and information to increase your selling decisions.
Before deciding to invest in a third-party option, it’s worth investigating whether or not these solutions offer enough capability to get the job done. But while there is a lot of great data here (it’s where most third-party tools pull their information), these reports present two significant challenges. There is a:
- Lack of hard numbers
- Lack of context
Most of the native Amazon reports don’t provide you with specific data points. Instead, they focus on comparative analysis. For example, the ABA Search Term Report will tell you the most-searched-for phrases, and the most clicked on ASINs, but not search volumes or how many clicks.
You also don’t get much product-specific information or insights into what you should do in order to improve outcomes. To do that, you will need to manually look up product listings and augment the data using spreadsheets and manual review.
Amazon’s reporting functions are great for a small Amazon business and new startups. But if you have a lot of product listings, the process of going from data to action is pretty unwieldy, and more sophisticated solutions will serve you well.
You can use Gorilla ROI to automate the data download into your spreadsheets.
Here’s an example of pulling listing information directly into sheets without any manual work.
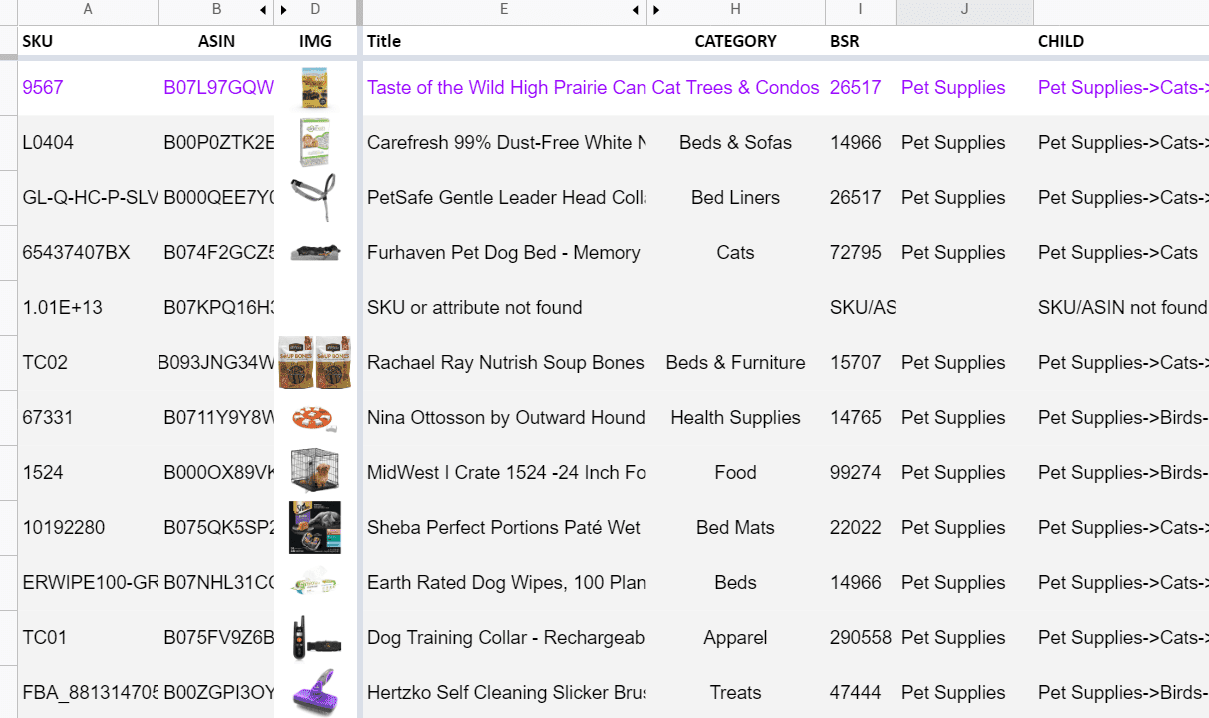
You can get this type of data by using a simple formula such as:
=GORILLA_PRODUCT(A1:A100, "TITLE", "US") where A1:A100 is your list of ASINs or SKUs - learn more
Step 3: Match the size of your operation to your data needs
Larger operations benefit from more sophisticated tools. The more products you sell (both in terms of product lines and product volumes), the more variables you have to deal with and the more value you will get out of data analysis. More sales mean more data, and more data means more accurate analysis and more challenging manual processes.
Starting out, you can go a long way by analyzing the performance of your Amazon listings with spreadsheets and Amazon’s own tools. All of the data reports offered by Amazon can be exported in .CSV files, and you can schedule emails to deliver them in regular intervals.
Manual processes will let you track simple long-term trends and craft personas that go beyond aggregate demographic data. But the volume of data flowing through Amazon will eventually make manual analysis hard and challenging to scale.
If you can get access to the data you want and need automatically, you can focus on analyzing and making insightful decisions.
- Centralize and simplify the review of data trends
- Provide both long-term and short-term views
- Better forecasting
- Understand which product categories are doing well and which ones aren’t
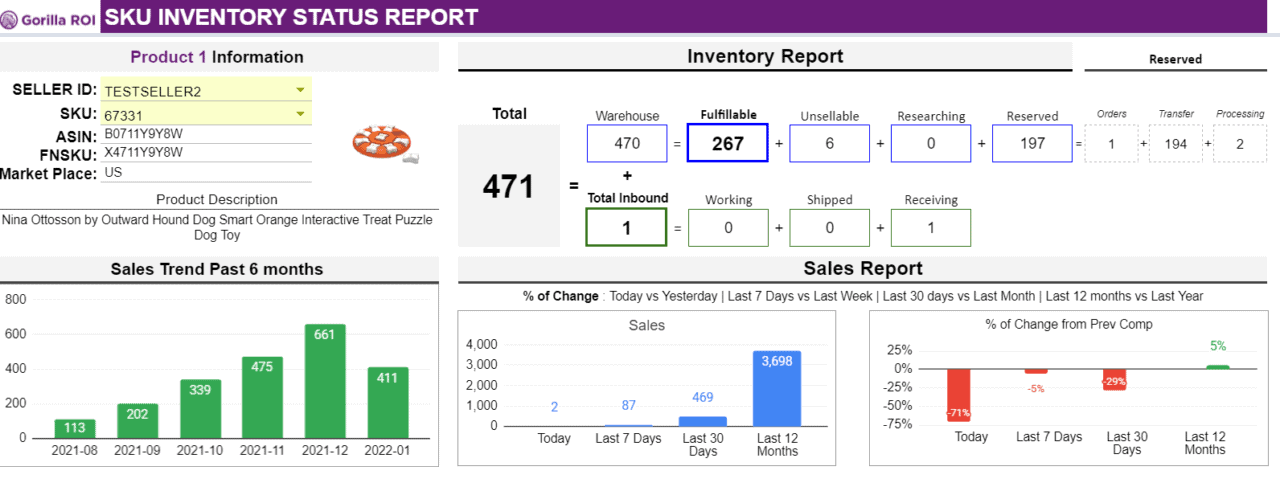
- Track the details of shipments and better inventory management and visualize inventory movement
This is what we offer with Gorilla ROI so that you can get the data with a click and also allow you to manipulate and use it in unique ways to fit your business workflow.
Automating your spreadsheets will be a godsend as you can free yourself from the manual work of collecting and organizing data and getting straight to see how your business is doing, and what actions you can take to improve it.

Step 4: Prioritize transparency and data access
All of this data analysis is about finding patterns and getting actionable data.
By understanding trends, you can repeat success and mitigate failure. With enough data, you can make accurate predictions and take action to stay ahead of the curve. The less time your team needs to spend crunching numbers, the more time that can be spent on using data-driven insights to strategize and act to create outcomes that matter. You want a tool that tells you why it’s making certain decisions and lets you export data. This helps with integration across your entire system but is also sign of a quality process.
Step 5: Always think about outcomes
A good analytics tool will help you:
- Take shortcuts to speed up manual processes
- Contextualize information
- Provide actionable and insightful information
- Tell you why something is happening
- Offer suggestions on how it can be improved
Here are some of the most important outcomes your Amazon analytics tools should be able to deliver, to make the best use of your Amazon data. For example, you can use sales and inventory historical data to forecast
Using your sales and inventory data, you can create your 100% custom sales and inventory forecasting system that is unique and fits your business.
This is an example where you can track daily SKU sales. By doing so, you can see the trend of your sales and know when something is not selling.

Step 6: Is there a plan for the future?
You don’t want to invest in software that’s only going to work for your business today. You want a tool that will help you grow, and scale with that growth — continuing to add value. When thinking about business objectives, you should go beyond your immediate concerns, and look at how you might want to use that tool in the future.
- What do you predict your next two or three business objectives will be?
- Will you expand to other marketplaces?
- Will you sell in more than a single category?
- Will your SKUs increase?
- Will you shift to data automation?
- What can you do if you hire more people?
Amazon is a continually shifting ecosystem so does the Amazon software you’re partnering with understand this? Are they committed to improving their products and services to align with new data as it becomes available?
At Gorilla ROI, we pride ourselves on having the more accurate and deepest integration to Amazon sales data and more. What does this mean? You won’t find another software provider continually adding new reports from Amazon so that you can access it directly without having to download it yourself. See our full data feature list for yourself.
Final Thoughts
Using an amazon analytics tool can help your Amazon business grow proficiently. It’s important to find the best Amazon analytics tools that fits your business process rather than trying to fit your business around a tool.
This way, you can focus on things that matter like your sales performance, PPC campaigns, Amazon fees, gaining valuable insights, improving your inventory manager, compare product ideas and so on.
There are so many tools for Amazon that it’s hard to choose. Find the right tool that will help you save time, gain insights, offers inventory analytics to improve your sales.
All-in-one tools may sound great and cheap, but we have found from experience that generalist tools for Amazon lack data and are a master of none.
Frequently Asked Questions
Does Amazon have analytics?
Yes. Amazon has basic analytics which Amazon sellers can use. The newer brand analytics is a good starting tool to gain product and performance info of other products. From marketing to strategic decision making, it helps in various ways.
How does Amazon use big data analytics?
Amazon big data analytics is a real game. Amazon gathers data based on its every user’s interaction with the platform. It then uses this information to make its proceedings efficient. For example, it opts for the warehouse that is closest to the customer.
Which AWS services are used for analytics?
There are several that are used. These include Amazon Seller Central interactive analysis, big data processing, data warehousing, dashboard visualizations, etc.
What is the best amazon product research tool?
There are several tools that can be considered in this matter. For starters, Gorilla ROI, ZonGuru, Unicorn Smasher, AMZBase, Keepa, CamelCamelCamel, etc. However, you should assess the tools before opting for them.
How do I find my Amazon conversion rate?
You’ll need to log in to your Seller Central account. Next navigate through reports, business reports, and detailed page sales. This will lead to traffic reports by child items. Here you can see your conversion rate easily.
Comments
Related Posts

10 Profitable Product Categories for Amazon Affiliates 2025
What you’ll learn Amazon is a favorite for experienced and…
Unlock the Secret to a Profitable Automated Amazon Store: How to Build a Hands-Free Income Stream
Ever dreamed of running a profitable Amazon business while sipping…

Master Amazon New Restricted Keywords: A Seller’s Guide to Success
Changes to Amazon’s restricted keywords list have taken a lot…


Leave a Reply