Article Summary (TL;DR)
✅ Learn how to implement effective demand forecasting strategies to boost sales and profitability while avoiding stockouts or excess inventory.
✅ Explore practical tools like seasonal adjustments, sales forecasting templates, reorder point formulas, and considerations for pricing and competition to refine your demand planning strategies and enhance business performance.
✅ Gain insights into the principles of demand forecasting, interpreting results, and applying real-life scenarios to optimize your business.
By the end of this article, you’ll know how to implement demand forecasting that works for your business. Make more sales and profit without going out of stock or sitting on too much inventory.
Demand forecasting isn’t hard. It’s a lot of common sense and understanding your business.
In this in-depth demand forecasting guide, you learn:
- How demand forecasting works
- How to interpret results from a demand forecasting analysis
- Real-life scenarios that apply to your Amazon or e-commerce business
- The best demand forecasting models for an e-commerce business
- Suitable metrics to use in a demand forecasting analysis
If you want the formulas and methods right away, jump to the start of the practical section with this link.
Why does demand forecasting matter?
If you are reading this, it’s safe to assume that you’ve run a business (or worked in one) long enough to understand the issue of going out of stock or sitting on too much inventory.
These are the two issues that every business wants to avoid.
- Going out of stock (especially best sellers or seasonal best sellers)
- Sitting on too much inventory
Ordering inventory and estimating demand based on an “empty shelf” isn’t going to improve your sales or cash flow.
Using old data and then projecting it will sell the same as before without thinking about the seasonality and current trends, which could mean you over purchase and tie up your cash on slow-moving inventory.
Demand forecasting is:
- an analytical process
- a method to use historical and seasonal data to predict sales trends
- to prevent going out of stock and to also prepare for sales spikes
The trend and demand for online shopping is only growing. 69% of Americans have shopped online. COVID19 is pushing this number higher as online shopping becomes more vital for people to get what they need.
In 2020 alone, millions of buyers flocked to Amazon to get their goods during the pandemic.
The surge in sales left many FBA sellers out of stock and missing out on huge sales and profits. Competitors took over the sales while you missed out.
If your business generates sales in the 5 or 6 figures and you are serious about getting into the 7-8 figure range, there is no excuse not to use demand forecasting and better demand planning.
If big sellers and companies rely on these planning strategies and calculations so much, why aren’t you?
Real demand forecasting scenarios
I’m going to revisit the 2 points frequently on this topic.
- Going out of stock
- Sitting on too much inventory
Going out of stock is one of the worst things to happen. It kills your momentum. If for this one reason alone, forecasting your sales and inventory is pivotal.
Because it is so easy to open an online business, competition is cut-throat. If you’ve spent time and energy to build your sales and then find yourself out of stock, it drains all the momentum you’ve built.
Getting more product in stock can take 30-90 days depending on where you manufacturer and by that time, potential customers could have moved on and bought from your competitor.
Went out of stock on Amazon
Here’s a real example that happens all the time.
We went out of stock for one of our best selling items on Amazon. We had more inventory on the way, but we didn’t factor into our forecast any potential spikes from summer sales.
Leading up to our boost in sales, we invested a lot of time and money into:
- PPC
- advertising on other channels
- creating sales funnels
- launches
This isn’t a few hundred dollars I’m talking about.
By the time we got the product back in stock, we had been out of stock for a month.
Rather than picking up where we left off, once inventory hit Amazon again, we had to:
- increase PPC bids
- restart ad campaigns with new ideas
- paid for launches again
After 2-3 months, we finally got traction to where it was before the product went out of stock.
During that 1 month of stock out and the 2-3 months of building sales up again, we lost a considerable amount of sales and profit to competitors who scooped up all the work we had done.
If you have best sellers on Amazon, do whatever it takes to keep it in stock. Better yet, improve your demand planning so that it doesn’t happen.
But it’s not just inventory when it comes to forecasting. Other factors include:
- Pricing – cheaper sells quicker
- Consumer trends – fads won’t sell
- Inventory lead times
- Seasonality and historical sales
Sitting on too much inventory
Here’s the reverse of the going out of stock.
Too much inventory.
- Drains cash flow
- Eats up fees
- Takes up space
- Wastes mental space as you figure out what to do with it
For Amazon Sellers (FBA and FBM) or other e-commerce sellers, planning and knowing your demand will put you ahead of the competition.
If you sell summer swimwear, it is seasonal and you don’t want too much supply after the summer period.
One of our products was in the grilling niche and the problem was that we received our product near the end of summer.
Ouch.
Not only did we mistime inventory, we completely missed out on all sales and ended up with too much inventory. This product sat in our warehouse for months without doing anything until we got creative and re-marketed it for a different industry.
But what if we didn’t have a warehouse to pivot quickly? What if we sent a whole container of this product straight to Amazon fulfillment centers without testing the product?
Double, triple, ouch.
Imagine, no sales, inventory fees adding up, long term storage fees approaching.
What a nightmare.
If you operate in multiple countries and platforms, it’s so important to track and forecast demand accurately because you lose a lot of control.
We ended up disposing of thousands of inventory in the UK because we weren’t able to sell enough and the fees were costing more than the product itself.
Tore the band-aid off and got out of UK and EU.
Inventory forecasting spreadsheet
You can use Google Sheets or basic Excel to create your own inventory management system. There is a free inventory spreadsheet template in the link.
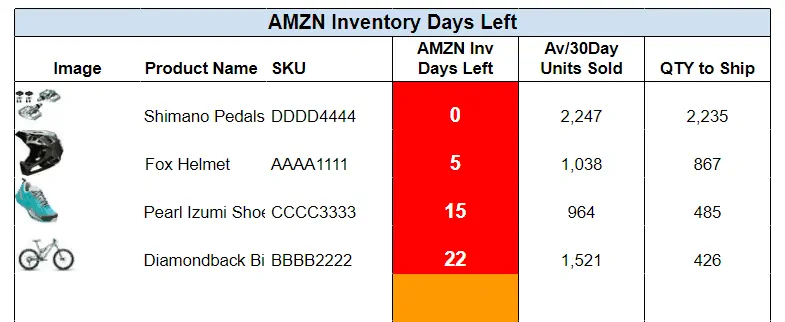
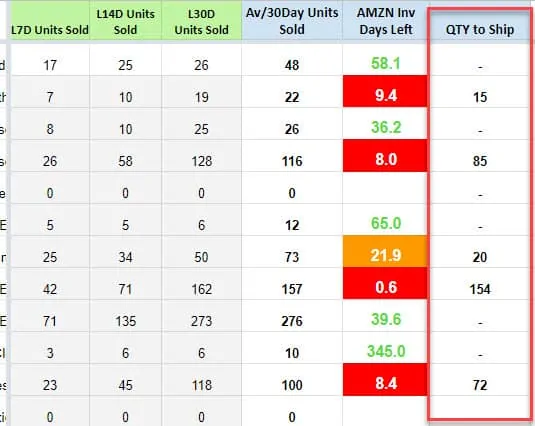
You can see from the screenshot how many days of inventory is left at Amazon, and how many units you should ship based on the average number of units sold over the last 30 days.
By using a formula like the following
QTY TO SHIP = AV30DAYUNITSSOLD X 1.5 - TOTALAVAILABLE
you can keep your inventory in check and you won’t go out of stock because you know how many units need to be sent in to maintain the inventory level threshold to meet your demand.
By understanding the sales demands and sending in the right amount to Amazon, you improve your cash flow by not overbuying and storing.
Get your free inventory template to use as an inventory replenishment tool to help you project the demand.
Economic Order Quantity method
Another basic formula to help with knowing how much inventory to plan and order is called the Economic Order Quantity formula. This works best if your costs are stable.
The EOQ is a company’s optimal order quantity that minimizes its total costs related to ordering, receiving, and holding inventory.
The EOQ formula is best applied in situations where demand, ordering, and holding costs remain constant over time.
Let’s assume the following:
- A cosmetics store sells 200,000 units of lipstick per year.
- Each unit costs $1
- Holding (storage) cost per unit is $1.80 per year ($0.15 per month)
The formula is:
EOQ = √(2DS/H)
where:
D=Demand in units (annual basis)

S=Unit cost (per purchase order)

H=Holding costs (per unit, per year)
EOQ = √[(2 x 200000 x 1) / 1.8] = 471.4
The ideal order size for this business is 471 units of lipstick to minimize costs but meet customer demand.
But only 471 units when this business sells 200,000 units a year? That’s the downside with simplistic formulas such as this.
Seasonality adjusted demand forecasting calculator
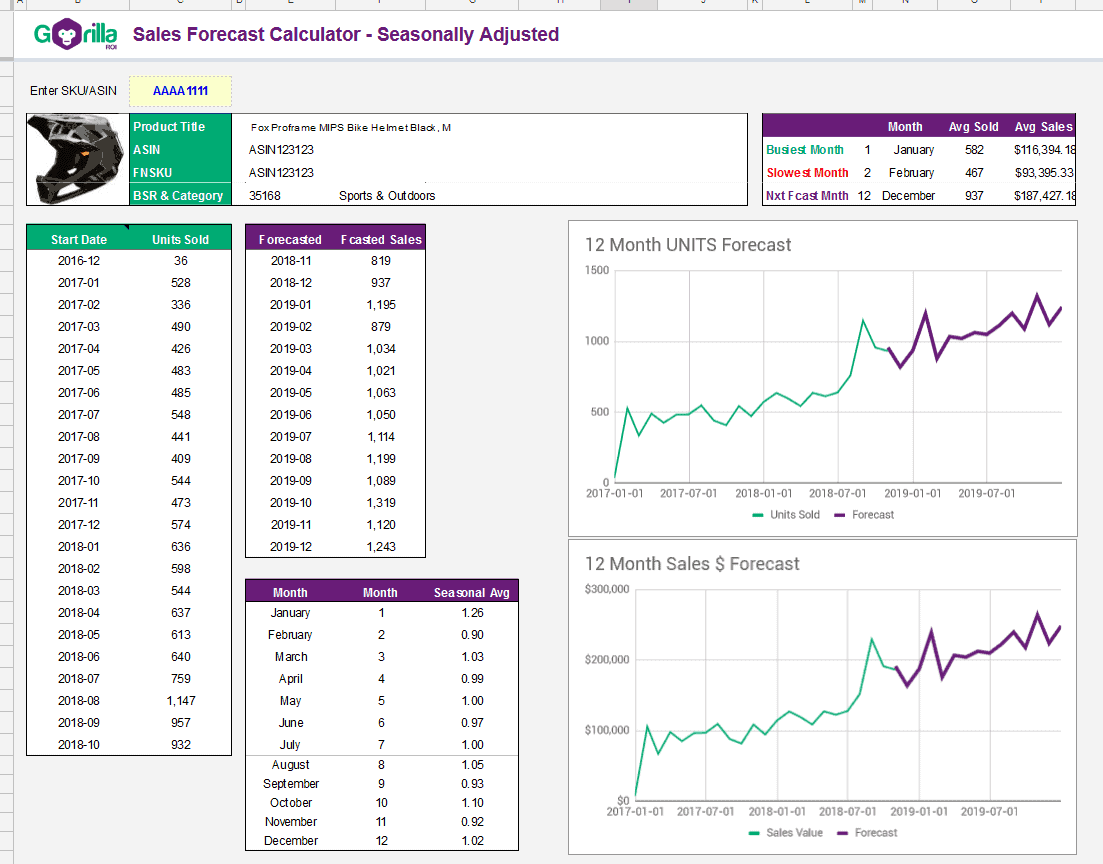
This is a demand planning and forecasting calculator that our PRO business spreadsheets offer to FBA sellers.
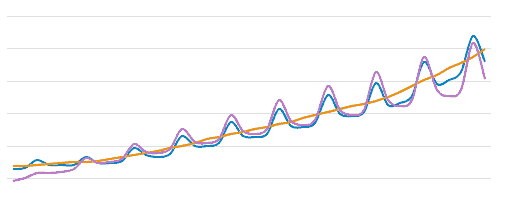
If sales were always a straight line, you’d never need to run any demand forecasting calculations.
But in reality, sales more likely represents the purple line.
The orange line is a straight line forecasting method that will either leave you out of stock or with too much inventory.
The blue line is the data you need when running a forecasting analysis.
The exact calculations are far too complex for this article, but here’s the big idea of how it works.
- Get at least 12 months (24 months is better) of past sales data with the number of units sold per month
- Get this number for each SKU. Sold per month over the past 12 to 24 months.
- The moving average is then calculated.
- A seasonal index is calculated for each month.
- A seasonal average is calculated.
- This number is then deseasonalized and a trend is projected.
If that’s too complex, then trust me when I say it’s easier to get the spreadsheet calculator for yourself and not have to worry about the details. It will cost you far more time and money to create your own calculator and won’t work anywhere near as accurately or better than our ready made solution.
Data required to create a practical demand forecasting analysis
If you are really keen on making your own, a good demand forecasting calculator needs to monitor business KPIs (Key Performance Indicators) as well as subjective factors.
Business KPIs
- sales per SKU
- sales per month
- inventory on hand
- inventory days remaining
- pricing strategy
- lead times
Subjective factors
- seasonality planning
- new product launch management
- production planning
- consumer trends
All these points add to demand forecasting in one way or another, but I’ve always found the best results by focusing on fewer pieces of hard data such as sales per SKU, units sold per month, inventory numbers, pricing and lead times.
The subjective factors can always be completely off and that will throw your numbers out the window. It is better to focus on the data that you have.
Let’s say that you have a new T-Shirt coming out in a couple of months and expect huge results and responses from the product launch.
The launch comes and goes and it was a flop. Now you are sitting on 100,000 units that are not moving.
Or what if you came up with the idea of having wheels at the bottom of shoes for kids to roll around.
You create it and launch it and no one buys it – because the Heely’s fad is dead.
Where to get data from seller central?
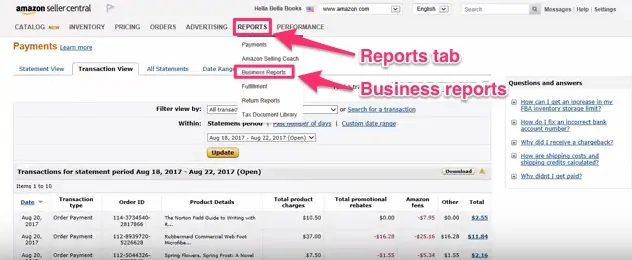
To get your sales data, go into seller central, and REPORTS > BUSINESS REPORTS.
Keep adjusting the time periods by month and then download the data.
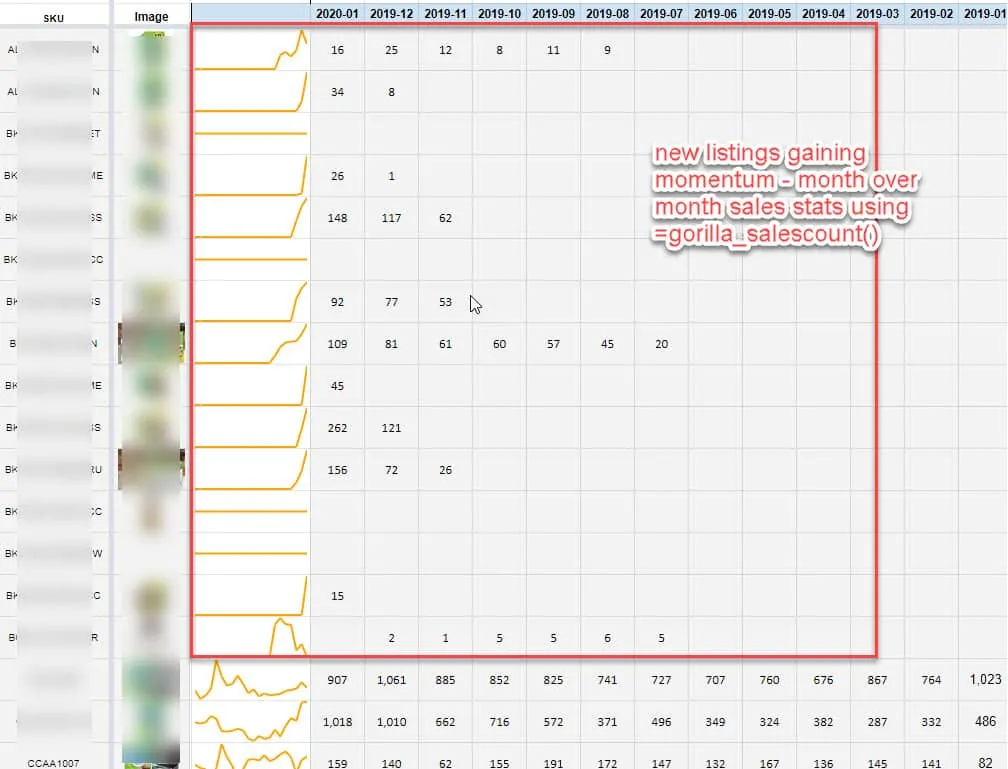
This will be very time intensive unless you have a sales software that you’ve been using, or use Gorilla ROI to load this type of seller central data immediately into Google Sheets like below.
For inventory data, do the same thing by exporting the data from your seller central account.
- Go to REPORTS > FULFILLMENT REPORTS
- Download the Amazon Fulfilled Inventory Reports.
- Adjust the dates as needed to get monthly data.
With this data, you can use it to create projections and forecast or plug it into free forecast spreadsheet templates from the internet.
Here’s ours you can use.
Basic demand sales forecasting template
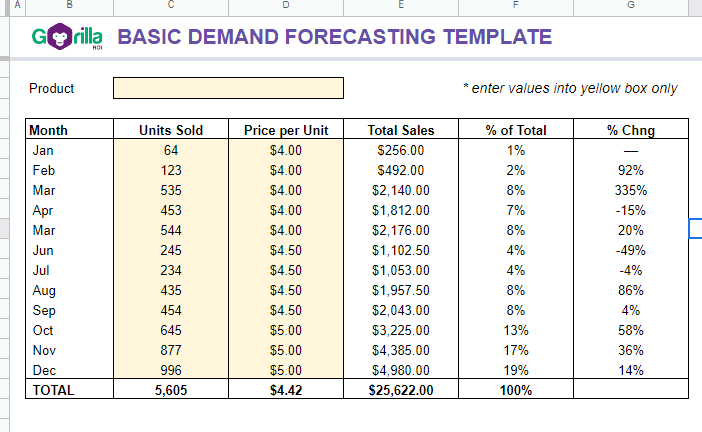
This is a free Google Sheets version of a sales demand forecasting spreadsheet.
You need your sales data by month to enter into the spreadsheet.
Step 1: Enter the product name so you know what you are analyzing.
Step 2: Enter the units sold per month
Step 3: Enter the unit price as it can change month to month
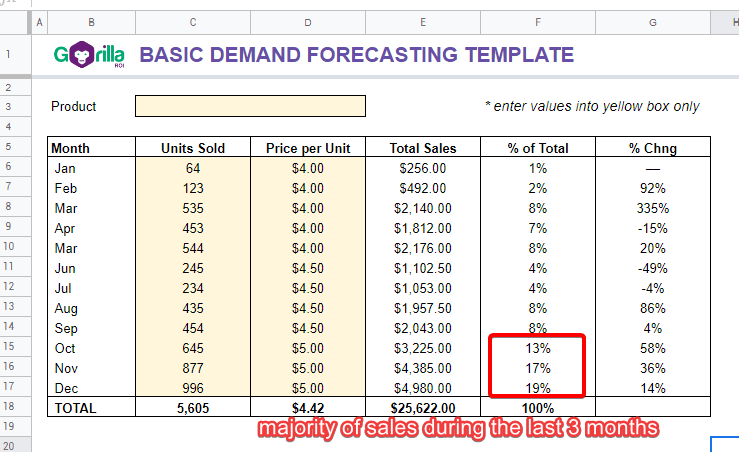
The spreadsheet will show you which month makes the biggest volume of sales for you to plan your inventory.
Repeat for all the SKUs you need to analyze. Remember this type of forecasting is done per SKU. Not by total sales.
When you are ready, upgrade to our automatic forecasting calculator which will make all this work effortless and more accurate.
Reorder point formula
I touched on this with the earlier example of the lipstick example. It’s good to know how many units to order, but when should you reorder?
Basic Reorder Point = Average Daily Sales x Lead Time + Safety Stock
This requires a good understanding of your supply chain as lead times will play a major role.
First, you must have safety stock which is a buffer of extra inventory to prevent stock-outs. If you only order exactly what you think you need, without any safety stock, you will run out of stock if any sales spike occurs.
A very basic safety stock calculation is to get an extra X number of days of inventory.
If Loreal sold 100 units of lipstick a day and wanted to keep 14 days of extra safety stock, that would be 100 x 14 = 1400 units extra when reordering.
Reorder point example
Let’s say I’m selling high end Office Chairs.
- daily sales over 3 months = 26
- manufacturer lead-time = 120 days
- safety stock = 14 days = 14×26 = 364
Reorder Point = 26 x 120 + (14 x 26) = 3,484 units
When my inventory reaches 3484 units, I must reorder so as not to go out of stock.
This basic version works whether you sell on Amazon on in brick and mortar sales.
Thoughts on other forecast demand methods
There are plenty of other methods.
Before you came to this page, you’ve probably gone through sites mentioning the following:
These qualitative methods can be used, but if you’re an Amazon seller or small to medium business, it is useless.
Sorry if that ruffles a few academic feathers, but I’ll say it again. These are useless in the real world for small to medium businesses.
Unless you have gobs of time and thousands of dollars to waste, gather this type of data for forecasting is pointless.
Stick to quantitative forecasting where you can use data to:
- understand what products customers are buying from you
- see which products are gaining momentum
- create trends and projections based on past sales data
- identify slow-moving products
- understand current demand vs previous months or periods
You can’t get any of this insight from asking strangers who have never bought from you or answers from random surveys and polls.
Other factors that play a role in demand planning
Up till now, I’ve made the assumption that everything remains the same such as your costs, pricing, economy, politics etc.
But life’s never like that right?
Consider the following that will impact your demand.
Pricing
Your pricing formula affects the buyer’s decision to make a purchase.
You’ll obviously sell more if the product is a highly desired item and the price is cheap.
If you plan to run heavy promotions and sales, then your demand will be higher. You can account for this by adding a bigger buffer to your reordering quantity calculations.
If the calculation tells you to order 5000 units with everything stable, then go for 6000 units if you want to run a strong ad campaign.
Just make sure to use the Amazon fee calculator to nail down the best pricing. What’s the point of doing business if you don’t know what your break-even point is.
Knowing details upfront like – how much is the expected profit you are going to make from the lower price vs the higher price, how quickly you expect to sell through, and how quickly you can reorder is important.
Most successful sellers on Amazon also use the price elasticity of demand to set their pricing policies.
The price elasticity of demand calculates how receptive the target market gets towards demanding your products when you adjust the price.
A lot of times on Amazon, or in huge demand markets, the market is willing to pay a higher price.
Take disposable masks for example.
The regular price used to be about 10-20c per mask. With the surge in demand, the price per mask is now easily 50c to $1 and there are still availability issues.
If you are the brand owner and the only one selling an in-demand product, pricing will be less of a factor because shoppers cannot price shop your product.
Competition/ substitute availability
Every e-commerce merchant needs to get along with the fact that competition is infinite and grows each day.
Buyers review other options before deciding to purchase your product.
And if you’re already selling on Amazon, chances are, there are possibly hundreds of substitute or knock off products in your niche.
If your product and brand are already established, then it’s easy to judge the demand because it will likely be stable.
But if you are trying to enter a fierce and competitive industry, the demand for your new product will be considerably lower than an established seller or product.
Comments
Related Posts
Smart Guide to Import Amazon Data to Google Sheets
Running an Amazon business means juggling dozens of moving parts:…
The ultimate guide to Shopify marketing attribution: what works best for your business?
What you’ll learn Have you ever wondered where your customers…
Top 5 Strategies to Sustainable Shopify Growth: Turning One-Time Buyers into Lifetime Customers
What you’ll learn As a Shopify seller, you’re constantly looking…





Leave a Reply