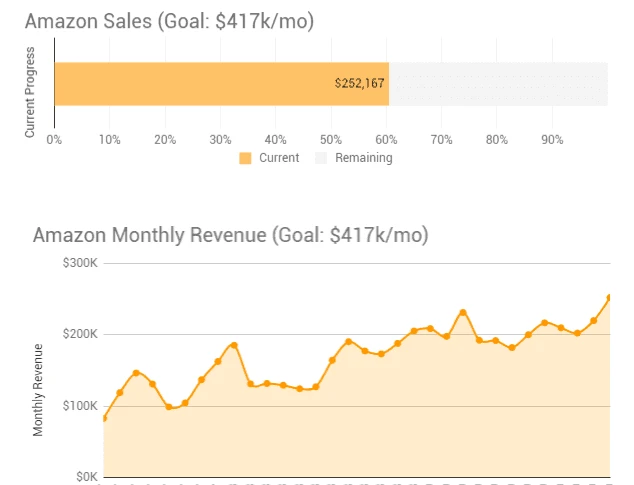
Gorilla ROI Amazon sales progress. To see the interactive version, go to this page.
Note: These monthly updates are for educational purposes.
Article Summary (TL;DR)
✅ Explore the performance metrics and milestones achieved in December for our FBA business, reaching $252K in sales.
✅ Gain insights into the challenges faced and lessons learned during the month, highlighting opportunities for improvement and future growth.
✅ Learn about the strategies implemented to drive sales growth, including inventory management, pricing optimization, and marketing efforts.
For the first time, our financials was the easiest to organize this year.
Used Gorilla ROI to pull in my inventory history for Dec. 31, units sold, finances, fees and charges and finished the books in less than a day.
I skipped November numbers and since it’s the end of the year, I’ll focus on December and this year’s total figures.
I’m also going to share P&L percentages that should make you think about your performance.
We aren’t perfect, but when you look at our percentage of revenue we spent on ads, operating expenses, rent, and inventory, it will help you gauge the health of your business and figure out what your benchmark it.
By knowing your percentages, it makes it easy to track the progress and performance of your business.
You’ll see what I mean below.
Let’s begin.
December highlights
- First time passing the $250k threshold
- Ended the last month of the year with $252k in revenue vs $201k in the previous year
- 25% growth from last year
- Consistent conversion rate of 20.5%
- New SKUs launched at the end of the October and November pushed sales and visibility throughout December and into January of the following year
Year-end highlights
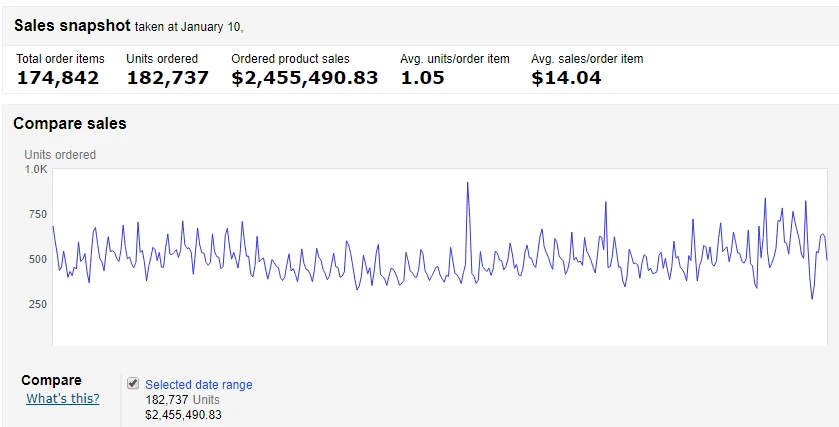
- $2.45M in revenue vs $1.85M in the previous year
- Ended the year strong to push the annual growth to 32%
- Able to increase margins in the 2nd half of the year to boost cash flow
- Added 10 SKUs at the end of October and November which boosted sales
- More bundles and combinations of existing added – not new products
- Focused on leveraging existing strong sellers instead of trying to launch and compete with new products with no track record
- Operational efficiency stayed the same = more margin
- Working to build a team. Get away from being a jack of all trades.
- Made in China products made up 1/3 of total sales.
Lowlights for December and year-end
- Gross profit down due to more losers than anticipated
- Inventory increases due to slow-selling and dud products
- Got killed in competitive categories
- Losing my shirt on Amazon EU
- Facebook ads didn’t work out as well as I hoped. Got some results, but still a long way to go.
- Chinese copycats outselling our first to market products.
December and Beyond on Amazon
This year is in the books.
In my Amazon newsletter, I mentioned a couple of vital trends you must be aware of.
- Amazon will continue growing despite its dominance in e-commerce.
- Long-term profitability and performance will be built on finding products with competitive advantages that Chinese sellers can’t copy.
If 1-day prime continues to improve, it will be a huge boost to Amazon’s market share and sellers will benefit. Amazon got slammed with orders and delayed shipments in December, so they have a long way to go.
The flipside is that more shoppers will shop on Amazon for fast(er) shipping, and the conversions on your own website will likely drop if you can’t offer a similar service.
Keep in mind that “Free” fast shipping has become a right more than a benefit. People are willing to spend $15 on a product vs $10 for the product + $5 shipping.
If you want to take advantage of Amazon’s platform, what’s a seller to do nowadays?
Amazon keeps courting China manufacturers directly.
Sooner or later, you will be fighting against the manufacturer and they can either stop selling to you OR undercut you on Amazon directly.
If you are serious about winning against Chinese sellers, then you have to go where they can’t.
The higher the barrier the entry, the safer you will be. Long term, you will be safer with these types of products.
- Requires local licenses
- Needs FDA or EPA registrations/certificates
- You hold utility patents (not trademarks)
- Requires strict quality control
- You own intellectual property or formulations
- Regulated food and digestible goods
- Sourcing from outside of China
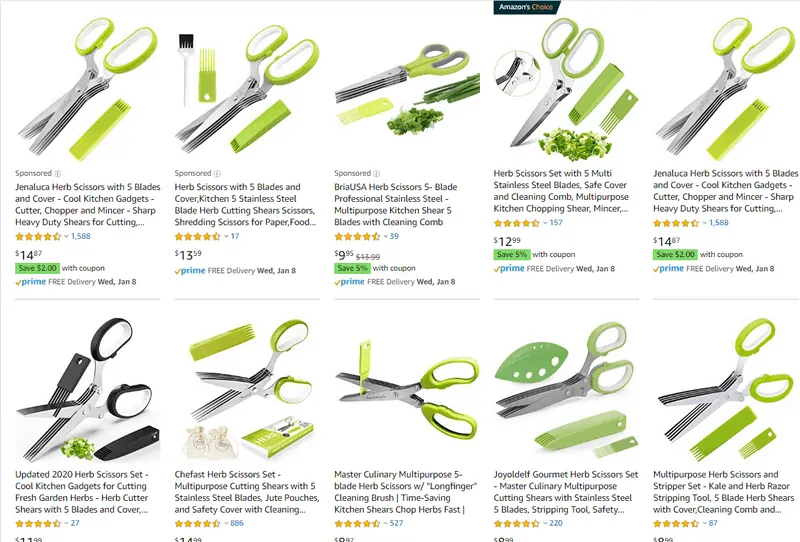
These are the areas that copycats can’t follow. Otherwise, you end up with products like… herb scissors.
If you go through the trouble of creating barriers, and sellers find your listing using scouting software, they’ll skip it as the barrier to entry is higher than normal.
Most people won’t even try because they want to follow the “low risk & guaranteed” blueprint sold on youtube and through courses.
Growth Plans
At the end of the year, our small team sat down and we did a post mortem analysis of every SKU for why it did well or not.
This was a fantastic exercise because it identified key factors for our business.
We were wasting a lot of time, energy, money and inventory by trying to launch products in different categories instead of focusing on our existing strong sellers and figuring out how to take them further.
If growing means launching more products, rather than launching random products like a shoe, lawnmower, hairdryer, and becoming another Walmart, we realized it is wiser to launch the same number of SKUs by going horizontal AND vertical and using variation listings.
Horizontal is where we come with a line extension that is similar in terms of price and quality. This could be a different color, size or scent.
Vertical extension is to create a cheaper or more expensive version.
Until now, if we were selling beach balls, we were only selling 3 colors for the longest time.
I didn’t think about expanding to different sizes, quantities, colors, bundles, and other combinations to go horizontal and vertical.
The 10 new SKUs we launched in Q4 were all variations and it worked.
Before, if we owned 2 spots on the first page. We now hold about 3-4 spots on the first page results – before PPC. More visibility equals more sales.
We’ll be focusing on creating and sourcing products that we can create bundles out of. Rather than keeping a SKU to itself, I want to be able to sell a single SKU in 5 to 10 SKU variations and bundles.
Based on our failed products last year, I told the team that I want to reduce the number of new products developed. That’s always harder said than done because I have far too many (bad) ideas pop up.
But our focus will be to continue improving our product launch process to get the ball rolling. The cost per review is getting higher because of the strict rules Amazon lays out.
If you do the math and find that your cost per review is less than $20, you have a gold mine.
With one of our newer products, it’s costing about $60-$100 to get a single review through discounts, Facebook ads and ManyChat bots.
Ouch.
Always use Amazon vine review program and Amazon’s reviewer program when you can. It’s now the cheapest way to get your initial reviews.
If we can find the secret sauce on product launches, then it’s just a matter of feeding new products into the system and scaling up.
Measuring performance with Gross Margin Return on Investment (GMROI)
Our margins really picked up in Q4 compared to last year. That’s the beauty of bundling.
Creating bundles allows you to:
- target a different set of keywords
- increase the total price
- Amazon fees become cheaper
- fatten margins
- leverage existing listings
- increase inventory turnover
If that doesn’t convince you, I don’t know what will.
Conversions stayed the same at 20%, fees were also the same, but the order value went up.
For the first time, we also didn’t run out of stock on any of our products during December. This time, we marked on the calendar to pad up our best selling inventory to last us through Q4 and Chinese new year.
But how do you know your gross margins and inventory levels are effective.
This is where GMROI (Gross Margin Return on Investment) comes in.
GMROI = Gross Profit / Inventory
This is something I’ve implemented recently to track the effectiveness of our inventory.
It achieves two things:
- shows you a single number which I can relate to inventory valuation
- shows you how effective the inventory is working for your business
No one wants excess inventory, but because of growth, how do you know what is a healthy amount of inventory?
The higher the GMROI, the quicker your inventory turnover is, and your cash is not being locked up in inventory.
The lower the GMROI, the slower you are selling and more cash is being locked up.
In retail, a rule of thumb is to have a GMROI from 2.5 to 3.2. This means that for every $1 of inventory, it generates $2.5 to $3.2 in gross profit.
For our Q4 numbers, we did around $600k in sales and our inventory value was $170k.
Our Q4 GMROI = 600k/170k = 3.5
2019 annual GMROI was between 12.5 to 14.7 depending on how I calculate the average inventory. But I’ll use 12.5 to be on the conservative side.
12.5 is a healthy number, but I know we can do better considering our small size.
I should be aiming for a quarterly GMROI of 4. This means that Q4 should have achieved either:
- sales of $680k or
- inventory value of $150k
The answer is that #2 should have happened. I overstocked some items and also had underperformers.
I find this to be easier than calculating Inventory turnover or Days Sales in Inventory (DSI). It doesn’t make sense to track only the inventory value as it doesn’t mean anything on its own. It needs something to be measured against to be effective, and in this case, it is gross profit.
As usual, I find it important to compare against public companies because that’s the type of group I want to visualize competing against.
No point in feeling good when you compare yourself with weaker competitors.
- Proctor & Gamble (PG) annual GMROI = 6.4
- Helen of Troy (HELE) annual GMROI = 2.1
- Nike (NKE) annual GMROI = 3.1
- Target (TGT) annual GMROI = 2.3
- Apple (AAPL) annual GMROI = 23.9
- Johnson & Johnson (JNJ) annual GMROI = 6.3
- Johnson Outdoors (JOUT) annual GRMOI = 2.65
Apple has an exceptional GMROI of 23.9. That’s elite.
Above average is 6.0+.
Looks like bigger established companies happily fall between 2.3 to 3.1.
We are looking good, but our small size makes us look better than we really are. Despite our tiny size compared to Apple, they are kicking our butts.
If you use this metric, make sure your inputs are consistent with comparables. Don’t compare annual to quarterly and vice versa.
Financial performance benchmarks
Here are some broad numbers of how this year went down.
- COGS was 23.3% compared to 26.1% in 2018 ✔️
- Amazon fees came down to 40.6% of revenue compared to 42.4% in 2018 ✔️
- Gross profit of 32.9% vs 28.6% in 2018 ✔️
- Amazon ads increased to 12.4% vs 10% in 2018 ❌
- Total operating expenses came to 25.5% vs 23.8% in 2018 ❌
- Operating margin was 7.3% vs 4.8% in 2018 ✔️
The biggest improvement for us is the reduction in Amazon related fees as it makes up a huge chunk up for all Amazon businesses.
The previous year was a bad year where costs got out of control, and this year we saved money by eliminating bad products that we had to continually discount and promote to liquidate.
As I noted above, this was the first year we didn’t run out of anything in December. We projections were right on target using our inventory forecasting calculator. You need at least 1 year of sales history to make it work.
This helped lower our storage costs as we didn’t have excess sitting at the FC and we were able to take advantage of Amazon’s discounted rates for keeping products in stock at optimal levels.
It also helped us improve our replenishment by sending in pallets. We weren’t rushing to catch up and having to send via UPS.
The savings from planning ahead and sending pallets were huge. Especially if you sell heavy stuff like we do where the cost per pound via UPS adds up quickly.
For 2020, my goals are:
- COGS of 22% vs 23.3% in 2019
- Amazon fees of 40% vs 40.6% in 2019
- Gross profit of 34% vs 32.9% in 2019
- Amazon ad spend of 12% vs 12.4% in 2019
- Total operating expenses of 25% vs 25.5% in 2019
- Operating margin was 9-10% vs 7.3% in 2019
China tariffs still ongoing
Sales from our made in China products made up close to 1/3 of our total revenue.
This is where we want it to be as it gives us some protection from geopolitical risk. If the trade war doesn’t get any better, we can switch to our manufacturers in other countries.
You know that you should have a backup plan for Amazon, and it’s the same for China suppliers. Tariffs on most products are now at 20-25%. Margins are feeling it.
I like to have a backup supplier that can take over manufacturing and switch production around as needed.
Manufacturing in EU was easier than I thought. The downside is the slow speed and the time difference. European companies aren’t as proactive and fast to respond as Chinese manufacturers. You need to fly over and hash out all the details to get things moving.
Books I read this year to become operations and execution focused
I’m building up my team to be operational experts because if the business operates efficiently and can execute on tasks, any business can get to 7 figures.
I also realized that getting from $1M to $10M in sales is simply scaling products more than anything else.
If the operational bedrock is solid, it makes scaling easier and faster.
I see from Facebook or forum questions that most sellers are focused on product expansion before they are ready, or they are limited to thinking about day to day sales and not beyond. Not many sellers address setting up a strong operational foundation where they could remove themselves from the day-to-day stuff and keep it going automatically.
Here are the books that helped me in 2019.
Walmart back in the early days was much different than today.
The way Sam Walton built the business, his philosophy and the way he implemented it provided great insights into areas of our business. It also reminds me of Amazon as I was going through the book. Eerily similar in how Walton and Bezos go about business.
Execution: The Discipline of Getting Things Done
A classic.
This book is strictly focused on execution, A.K.A getting things done.
I bet you have a massive list of stuff that needs to be done, but how can you make sure it’s done properly, on time and people take accountability for it?
What good are sales and marketing if people don’t understand how to execute it?
That’s what this book is about, and although the examples are outdated, the framework remains true, the questions and the way scenarios are analyzed feels like I’m going through an elite MBA.
I naturally lean on the operational side and I got a ton out of it. I know if the operations are not set up properly or lagging the growth, employees are overworked and stressed and it prevents the business from scaling.
The Goal: A Process of Ongoing Improvement
I shared this in my email newsletter and here’s what I said.
I wish I read this book when I first started my business. I’m about 10 years too late, but better late than never.
I find too many business books to be full of fluff pieces and mainly written to market themselves. Namely, putting F*** in the title seems to be the rage nowadays.
The Goal is different. It’s a classic.
It’s a business novel and that makes the reading easy, fast, highly enjoyable and practical.
I was skeptical in the beginning because it seemed so basic, but as it went on, new concepts and complex situations were introduced. Kept getting better and better.
The book takes place in a manufacturing plant, but don’t let that fool you. It’s applicable to any business as it introduces you to the concept of:
- Throughput
- Inventory
- Operational expense
“A plant where everyone is working all the time is very inefficient.”
If you want to know what the above quote means, read the book 🙂
By the end of it, I could see many ways it paralleled running an Amazon business and I started to think of how to implemented some changes in our operations from the ideas in the book.
Technically, I’ve had this book for a long time and applied in finance, but it’s just as good for Amazon.
I tend to have a lot of SOP’s (Standard Operating Procedure) for all the aspects of running our business, but sometimes the SOPs are too long to go through. And having a short checklist helps.
We use Trello to create a list for a particular process, and then add cards and checklists. You can then link the Trello cards to the SOP for people that need deeper instructions.
I want to take myself out of managing Amazon and going through the listings to make sure it’s done properly and to do that, I need to put what I know in a granular step by step checklist so things don’t get skipped, missed or done incorrectly.
The Outsiders: Eight Unconventional CEOs and Their Radically Rational Blueprint for Success
This book was recommended by Warren Buffett (he is one of the CEOs).
Here are the quick points [with my comments].
- Capital allocation – CEO’s most important job. [Not packing or doing design work. Bezos is not spending his day removing backgrounds from photos.]
- In the long term, the increase in per-share value matters. Not overall growth or size. [Work towards long-term profitability. Being the biggest company that is losing money is not desirable.]
- Cash flow, not reported earnings, is what determines long-term value. [Cash drives earnings. Earnings can be manipulated. Cash is king.]
- Decentralized organizations give an entrepreneurial spirit. Keeps costs and “rancor” down. [Amazon is a classic example.]
- Independent thinking is essential. Listening and pandering to outsider advisers [gurus, Wall Street, Facebook, media] can be distracting, time-consuming and wrong.
- Sometimes the best investment opportunity is in your own stock.
- Acquisitions: patience is a virtue and requires boldness.
Wholesale and our online store
Our wholesale revenue grew as we added another good size account.
Back in 2013-2015, we used to do a lot of tradeshows in WA to pitch our products and that’s where we:
- discovered our pitch
- realized some products sold best via sales pitches
Another seller in the tradeshow business noticed that we were coming regularly to the shows but he didn’t see us anywhere outside the greater Seattle area. So he offered to take over the tradeshows for us.
Their main distribution channel is via tradeshows, it is a win-win for both of us. I can focus on online sales and they focus on tradeshows.
This created more visibility of our products and we’ve gotten into more smaller stores and attracted more people who want to also sell our products at shows.
Now we are trying to expand presence to the East Coast where the majority of the population lives. Now we have to figure out how to execute it as I don’t want to be on the road every month exhibiting at East Coast shows to land a distributor.
Let’s see how 2020 turns out.
New Gorilla tutorials
To provide better information on how to better use the Gorilla functions, we have been writing tutorials and examples in more detail.
- Pull Amazon Best Sellers Rank (BSR) or Sales Rank into Google Sheets
- Track and import Amazon buy box price for FBA
- How to import Amazon seller fees into Google Sheets
- How to load FBA inventory data into Google Sheets
- How to get Amazon ASIN, SKU or FNSKU
Free FBA spreadsheets for all
If you have messy sheets and need something refined to help you run your numbers, get the free Amazon spreadsheets.
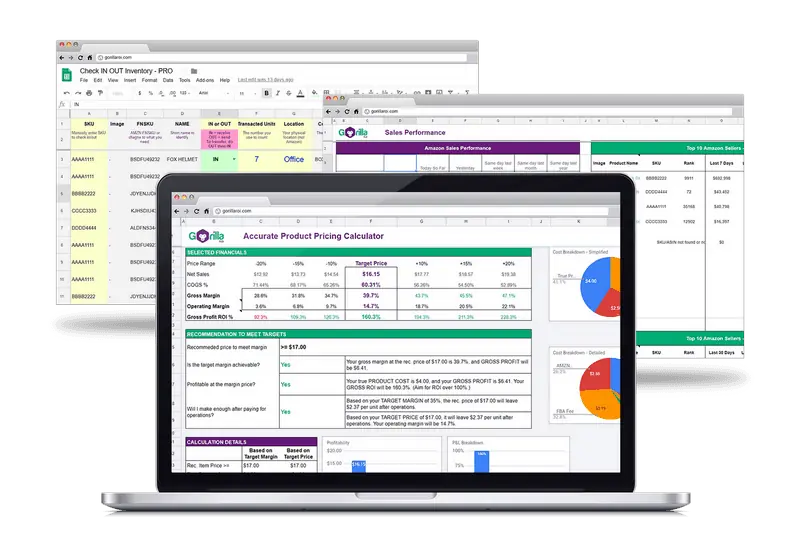
You can download it immediately without having to sign up for anything.
Just copy straight to your account.
If you want to get updated data straight into your own Google sheets, you can use Gorilla ROI. It makes work so much easier when you don’t have to manually update data or log into accounts constantly and wasting time.
Comments
Related Posts

10 Profitable Product Categories for Amazon Affiliates 2025
What you’ll learn Amazon is a favorite for experienced and…
Unlock the Secret to a Profitable Automated Amazon Store: How to Build a Hands-Free Income Stream
Ever dreamed of running a profitable Amazon business while sipping…
How Amazon DSP Works: A Guide to Programmatic Advertising for Amazon Sellers
Learning how Amazon DSP works could be a powerful advertising…









Leave a Reply