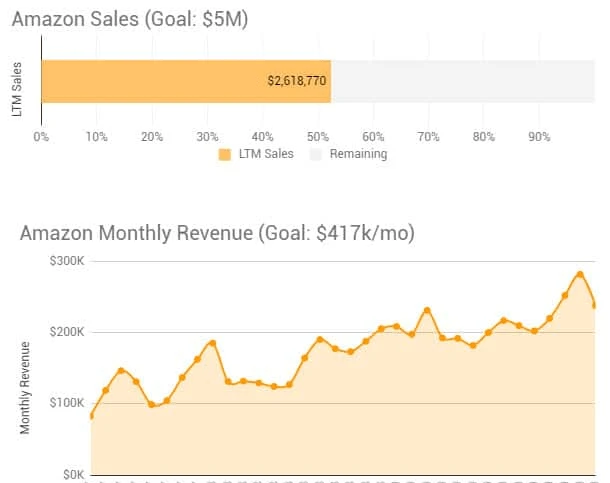
Current Gorilla ROI Amazon sales progress. To see the interactive version, go to this page.
Note: These monthly updates are for educational purposes.
Article Summary (TL;DR)
✅ Explore the performance metrics and milestones achieved in February for our FBA business, reaching $238K in sales.
✅ Gain insights into the challenges faced and lessons learned during the month, highlighting opportunities for improvement and future growth.
✅ Learn about the strategies implemented to drive sales growth, including inventory management, pricing optimization, and marketing efforts.
I’ve updated the chart to show the last 12 month (LTM) revenue compared to the goal of hitting $5M. Still a long way off, but the path to get there is clear.
Sales were down from January, which is expected because Dec and Jan are our best months. Then again, Jan this year was the best Jan we’ve ever had, so it’s hard to top that.
Nevertheless, this February was still a 20% improvement compared to Feb of last year.
Here are the stats and my thoughts.
February highlights
- Finished last month at $238k in sales
- 20% growth from the same month last year
- Margins increased slightly again as we had to raise prices to slow down sales
- Removed all coupons without any drop in sales
- Consistent conversion rate. Increased 1% to 21.1%.
Lowlights for February
- Best sellers out of stock (note the plural)
- Coronavirus, port congestion and delays
- PPC spend over budget
How Did February Do Overall?
If I was a robot and didn’t understand the current market sentiment, February did quite well.
There were hiccups in terms of supply chain and going out of stock which I get to in the next section.
Being up 20% compared to last year is a great start.
For a deeper context, in Feb of 2019, we had an average offer count of 59. This Feb, we had a total of 90. The 50% increase in SKUs was not a result of launching loads of new products, but simply creating more bundles and selling horizontally and vertically with our existing products.
We are now at a point where if we do bring on a new product, we can turn it into 10 different SKUs.
We’ve worked hard to go an “inch wide, mile deep” and now we can try and cast our net a little wider.
It’s still a numbers game because only 1 out of 10 listings will be a hit.
Based on our Amazon business model, I define a standard successful product as:
- selling over 1,000 units a month
- about 40% gross margins and 15% operating margins
There are different forms of successful products such as loss leaders, highest quality, highest margins and so on. It depends on your strategy, but to keep things simple, I’m just referring to the standard successful product definition for us.
Now, if the hit rate for a successful product is 1 out of 10, then it comes down to creating more variations and listing. To get 2 winners, it’s likely that I need 20 listings. To discover 3 winners, I’m going to need 30.
This is where the keyword siloing strategy I shared last month will help.
There are a lot of different ways to create variations so use some creativity because you just don’t know what people will like.
This is what we’ve experienced. Our hit rate total is going up and sales come with it.
The next thing I need to figure out is how to automate or at speed up the process of creating new Amazon listings using existing product information.
If you know of “flexible” software that can create new listings (not existing listings), please let me know – or maybe our Gorilla ROI team needs to create one.
Stopped all coupon sales
I’m a big supporter of coupons, and until the start of this year, I ran it on every product that could support it.
But it’s not cheap because coupons have an ACoS of 10% for us. 5% coupon plus the fee comes out to 10%.
If your products are priced $20+, the ACoS will be lower, but you are still giving up 5% at a minimum.
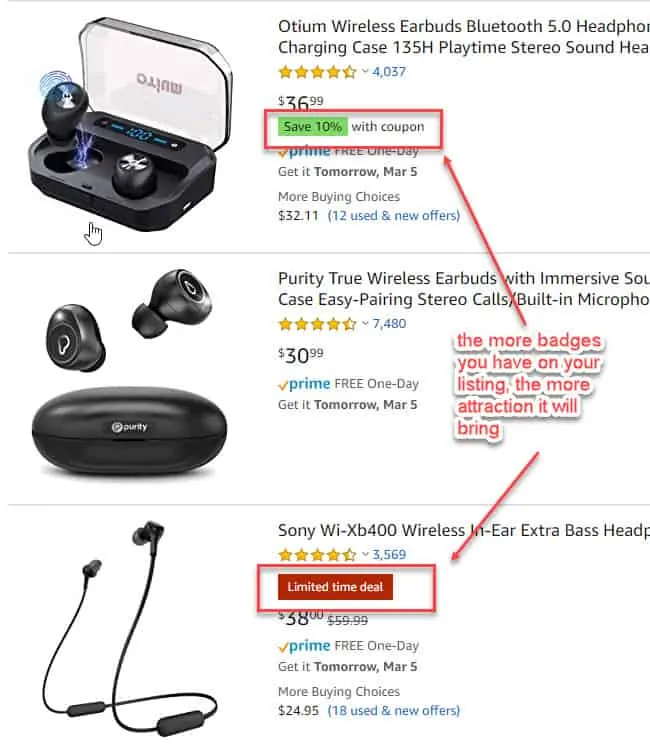
My reasoning for using coupons was to display the green coupon badge and get extra attention. Same goes for lighting deals.
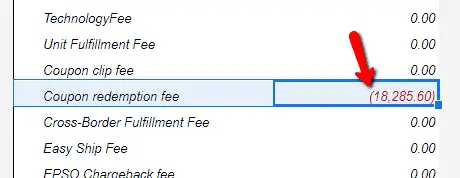
But after checking how much I had spent on coupons in 2019 using the new profit and loss spreadsheet, I knew I had to stop. We ended up spending $18k on coupons.
Looking back, this was $18k that we could have saved. It would have been easy and wiser to run coupons for a month, measure the sales and conversion rates, and then turn it off and measure again. If there is no significant difference, there’s no reason to throw money at it.
Lesson learned.
At least in 2020, I’ll be using this $18k somewhere else.
As you can see, turning off our coupons has bumped up our margins a fraction. This is always welcome.
But if you have high priced products and a big market like the bluetooth earbuds industry, and huge competition, applying the coupon makes sense as it can absorb the cost.
Just remember to factor it into your operational expenses because this is on top of the PPC you are already spending on the product.
If the first earbud listing has a PPC ACoS of 30% and then 10% on top of that, the ad cost is 40% on this product. Whether that makes sense is up to the seller.
Higher PPC costs
We ran aggressive bids in Jan to capture the spillover from Dec. Looks like we were are little too aggressive towards the end of Jan and starting Feb though.
My optimal level is to keep total ACoS across the company down to 10%. That hasn’t happened for several years though. A realistic target is now 13%.
However, YTD total ad spend is 14.2% so I’m spending too much and need to reign it in.
But there are always different ways to go about it. Normally, you’d just turn off ads or reduce the bids. That’s the easiest and most obvious way.
The other two methods are to:
- Not go out of stock. If the Amazon listing says “in stock on March xx”, but the customer clicked an ad to the listing and they bounce, that’s a waste of ad spend.
- Sell more, higher margin products. More profit for the same cost.
We’ve reduced the bids for crazy high keywords. That’s a no brainer and the products that went out of stock, we’ll monitor it again this month and adjust as needed.
Out of stock, supply chain, Coronavirus
Our calculations and forecasting were doing so well until it wasn’t.
We get 1/3 of our products from China, 1/3 from Korea and 1/3 from the USA.
Yup.
China got hit with the virus and we were glad we had diversified to Korea. But then Korea got hit…
In January, our Korean manufacturer just missed the container loading cut-off date so we lost 2 days until the next loading date.
But this was just before China got worse, so the next container we were waiting for at the Korean port, was stuck in China for 10 days before it finally arrived in Korea and our product got loaded.
This led to us going out of stock as sales kept increasing. Slight price increases, turning off the PPC helped a little, but not enough.
We went out of stock for about 3 of our best sellers in Feb.
Other supply chain issues came up like our US supplier missing our PO for 8 days.
It looks like more stock out.
We try to implement as much redundancy and checks to prevent this, but there’s only so much we can handle as they are external factors.
That’s the frustrating part.
I’ve been communicating with our manufacturers and while some are operating, many are still struggling to ramp up production.
A lot are still working from home, some say they’ve started production again, but it’s at limited capacity.
Another one of my manufacturers quoted a lead time reduction of 30%. I don’t know whether that’s a good or bad thing.
Our position is to remain cautious as I don’t believe anything the Chinese government puts out.
Financial performance benchmarks
I’m leaving the 2019 numbers here because doing these numbers on a month to month basis doesn’t make sense. There are high fluctuations from one month to another. Easier and better to do it quarterly to see if we are hitting our objectives.
For 2020, my goals are:
- COGS of 22% vs 23.3% in 2019
- Amazon fees of 40% vs 40.6% in 2019
- Gross profit of 34% vs 32.9% in 2019
- Amazon ad spend of 12% vs 12.4% in 2019
- Total operating expenses of 25% vs 25.5% in 2019
- Operating margin was 9-10% vs 7.3% in 201
Wholesale and our online store
I had some bad news about our wholesale customers trying to go around our back. Our products are patented (utility+design) so I’ll have our lawyer take care of it.
Otherwise, wholesale and online sales are still a fraction of our Amazon sales. Not much to share than that.
New tutorials and guides
We’ve published some awesome tutorials and guides for Amazon sellers.
- Detailed FBA reimbursement guide
- Amazon inventory management system using Google Sheets or Excel. Spreadsheet template included.
- Amazon FBA sales tax for sellers. What is collected and what you owe.
- How to create an Amazon sales tracker with Google Sheets
- This is why you should not use Amazon research tools on your listing – UPDATED
- Best software for FBA sellers and how we use it in our FBA business – UPDATED
People ask about advanced techniques and how to build better and dynamic spreadsheets. The first and easiest is to understand how to structure your spreadsheet.
Follow the first link on the Amazon inventory management system, or you can read this simplified best practice to creating spreadsheets.
Free FBA spreadsheets for all
If you have messy sheets and need something refined to help run your numbers, get the free Amazon spreadsheets.
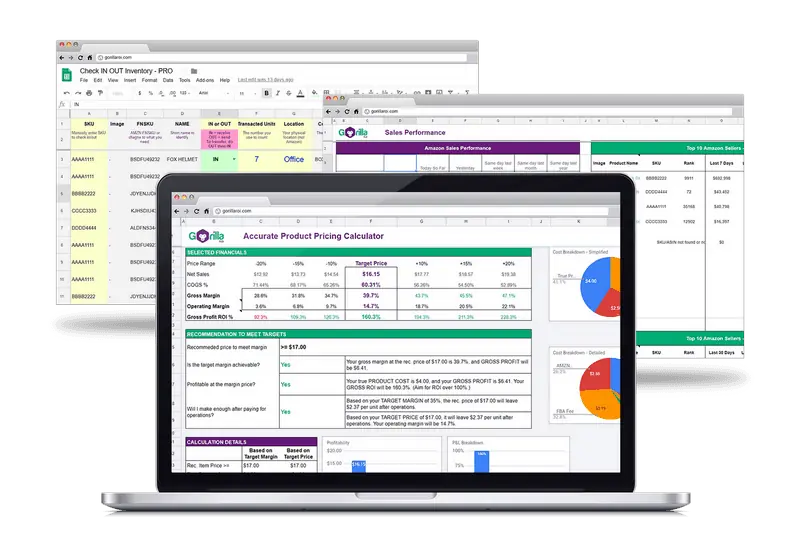
You can download it immediately without having to sign up for anything.
Just copy straight to your account.
If you want to get updated data straight into your own Google sheets, you can use Gorilla ROI. It makes work so easy when you don’t have to manually update data or log into accounts constantly and wasting time.
Comments
Related Posts

10 Profitable Product Categories for Amazon Affiliates 2025
What you’ll learn Amazon is a favorite for experienced and…
Unlock the Secret to a Profitable Automated Amazon Store: How to Build a Hands-Free Income Stream
Ever dreamed of running a profitable Amazon business while sipping…

Master Amazon New Restricted Keywords: A Seller’s Guide to Success
Changes to Amazon’s restricted keywords list have taken a lot…



Leave a Reply