Article Summary (TL;DR)
✅ Using a weighted sales velocity calculation to account for seasonality and sales spikes.
✅ Tools like the “Gorilla Sheets for Amazon” add-on automate data collection for better forecasting.
✅ Ignoring hidden steps (e.g., inspection, port delays) leads to stockouts and lost sales.
Lead time calculator and inventory management go hand-in-hand.
If you don’t get both aspects right, you lose a lot of money.
What you’ll learn today:
- How to calculate lead times
- How to use lead time in supply chain
- How you can improve lead time in inventory
- Free lead time calculator spreadsheet
- Free inventory days spreadsheet
Your lead time calculator is WRONG
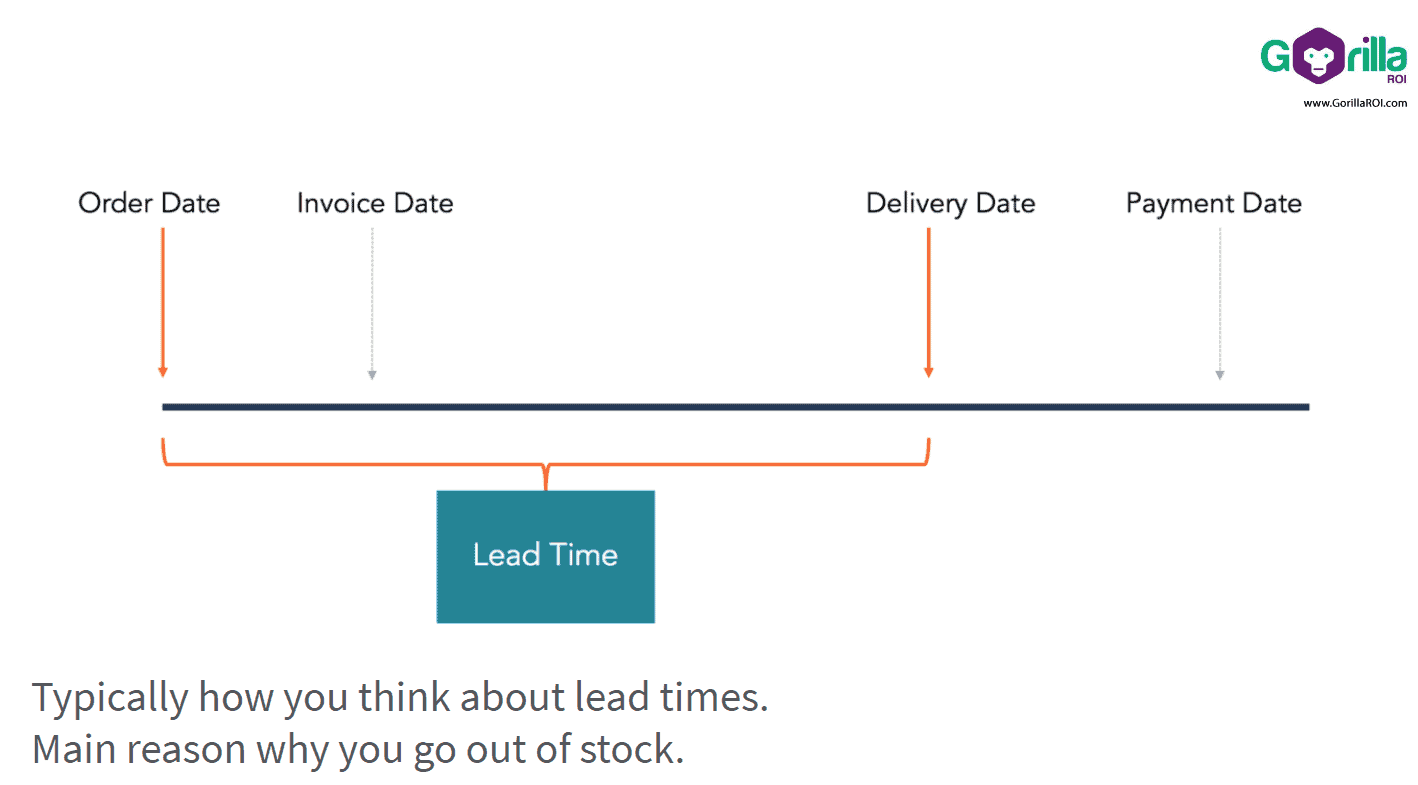
When it comes to lead times, if you are like most people, you only think about:
- time to manufacture
- time it takes to arrive
This is the biggest problem for why businesses go out of stock.
When calculating your manufacturing lead times, shipping lead times, and any other leadtime, it has to be very granular and broken down like your pricing/cost calculations.
When you calculate your margins, pricing and breakeven analysis, I bet you think about:
- cost to manufacturer
- packaging components
- handling charges
- duties
- taxes
- shipping
- and anything else that goes into making the product.
Lead times should be done the same way to factor in all of the following and more.
- time from order submission to get raw materials
- time from start to end of production
- time for QA or send inspectors
- time to remake failed units
- time to pack and ship
- time at the port of departure
- time on the boat
- time at the port of arrival
- time of potential x-rays and exams
- time of delivery
- time to inspect
- time to repack
- time to ship to Amazon
- time to get to Amazon’s warehouse

If total lead time calculation is based on:
time to manufacture + time it takes to arrive
You will have endless stock outs, lose sales to competitors, waste money on ad spend because you don’t have product to sell, and more.
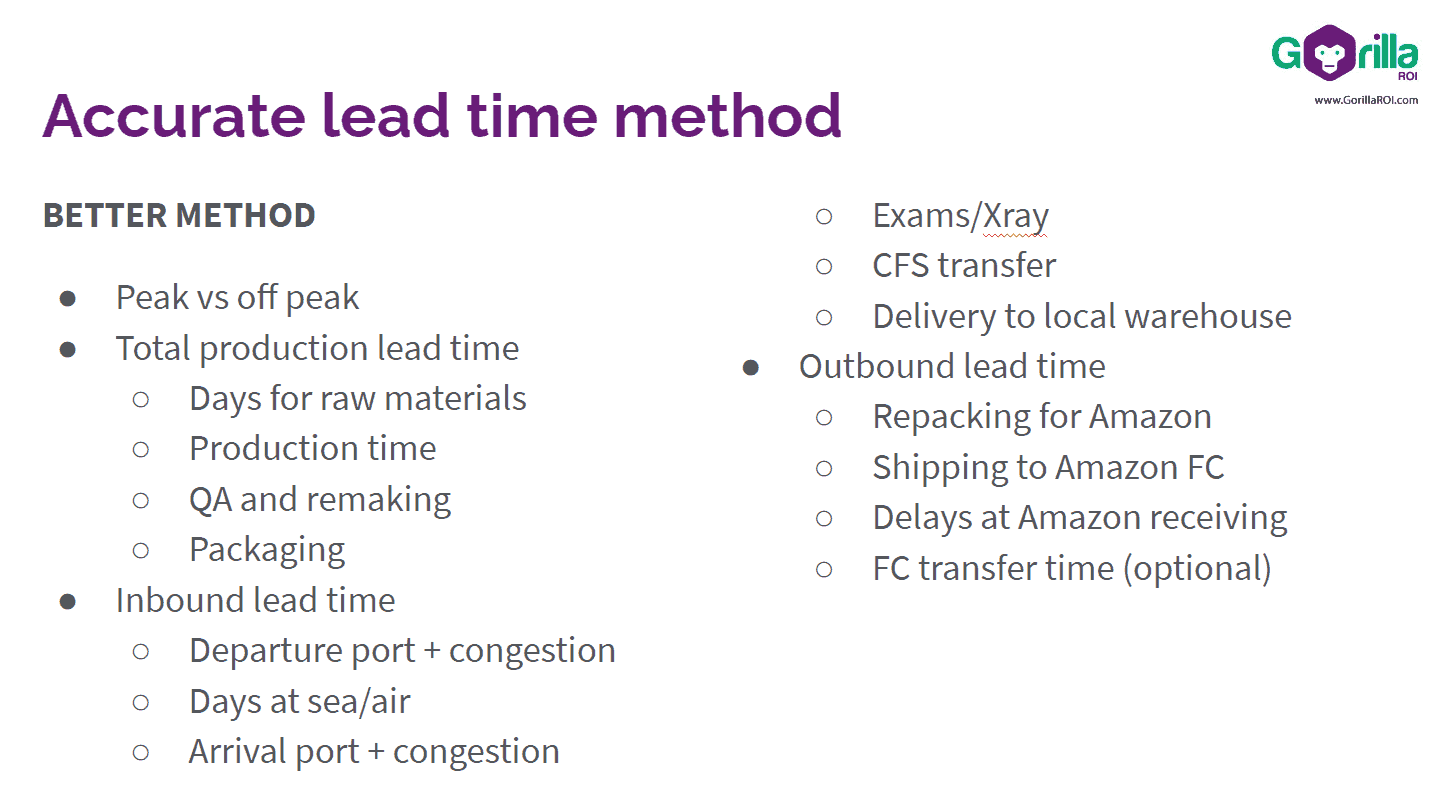
Detailed lead time calculation breakdown
- Peak vs off peak ( lead times will differ based on the peak or off peak season)
- Total production lead time includes:
- Days for raw materials
- Production time
- QA and remaking
- Packaging
- Inbound lead time includes:
- Departure port + congestion
- Days at sea/air
- Arrival port + congestion
- Exams/Xray
- CFS transfer
- Delivery to local warehouse
- Outbound lead time includes:
- Repacking for Amazon
- Shipping to Amazon FC
- Delays at Amazon receiving
- FC transfer time (optional)
Yoga mat lead time breakdown example
Let’s put this into use with a yoga mat product example product to calculate the lead time from your supplier to Amazon.
Basic lead time formula
Using the common formula of manufacturing + shipping = total lead time.
- Yoga mat supplier lead time = 25 days
- Shipping lead time = 20 days
- Total lead time = 25 + 20 = 45 days
Detailed lead time calculation
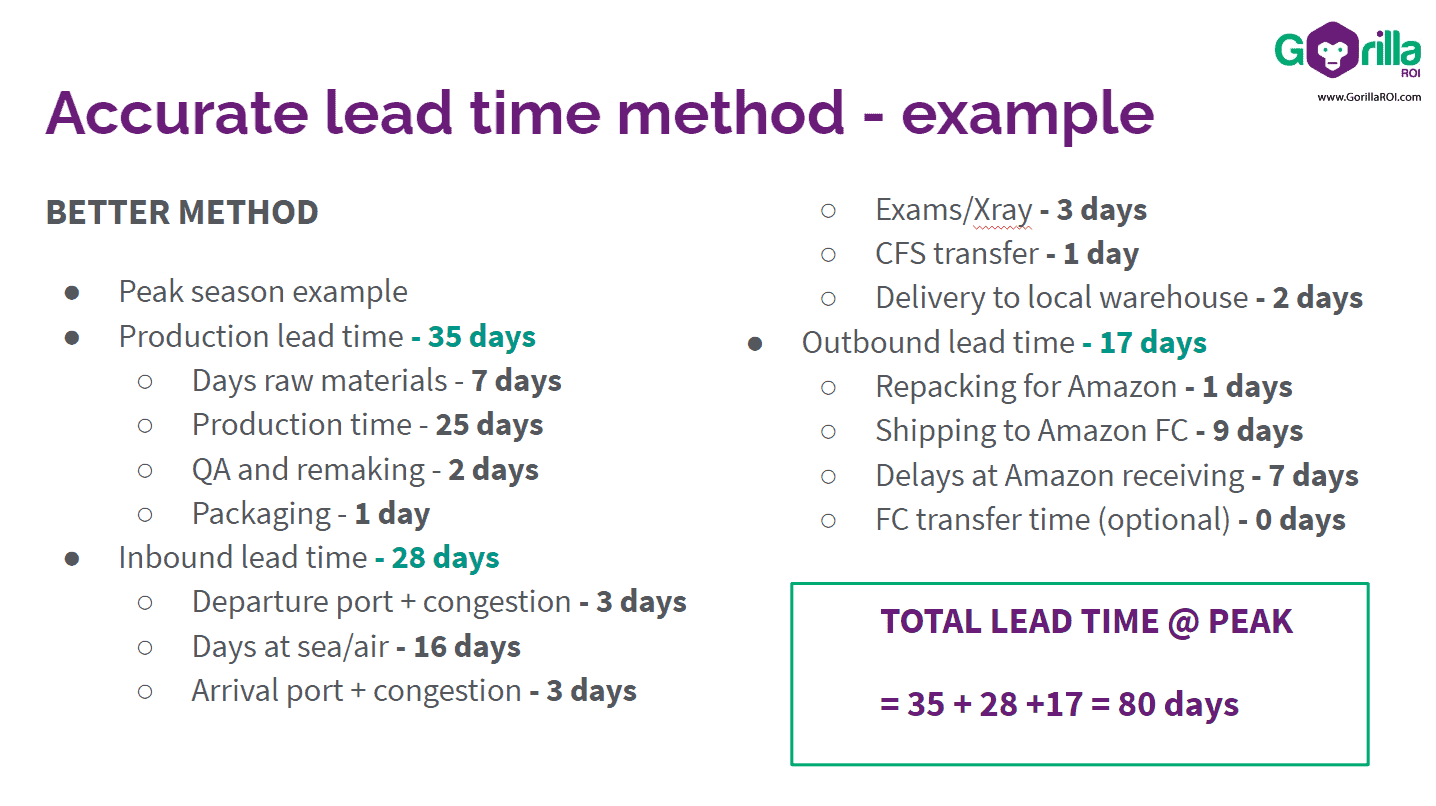
- Peak season example
- Production lead time – total 35 days
- Days raw materials – 7 days
- Production time – 25 days
- QA and remaking – 2 days
- Packaging – 1 day
- Inbound lead time – total 28 days
- Departure port + congestion – 3 days
- Days at sea/air – 16 days
- Arrival port + congestion – 3 days
- Exams/Xray – 3 days
- CFS transfer – 1 day
- Delivery to local warehouse – 2 days
- Outbound lead time – total 17 days
- Repacking for Amazon – 1 days
- Shipping to Amazon FC – 9 days
- Delays at Amazon receiving – 7 days
- FC transfer time (optional) – 0 days
TRUE lead time = 35 + 28 + 17 = 80 days
The difference between the basic lead time of 45 days and the true leadtime of 80 days is a massive 35 days. 1 whole month difference.
And now you can see why you are always wondering why you go out of stock.
If you have 60 days of inventory left and think ordering now gives you plenty of time – wrong.
You are already behind by 25 days and will be out of stock for one whole month.
- competitors will take over your sales
- competitors will rank higher in the search results
- competitors will convert using your keywords and brand
- you have to spend more to regain traction
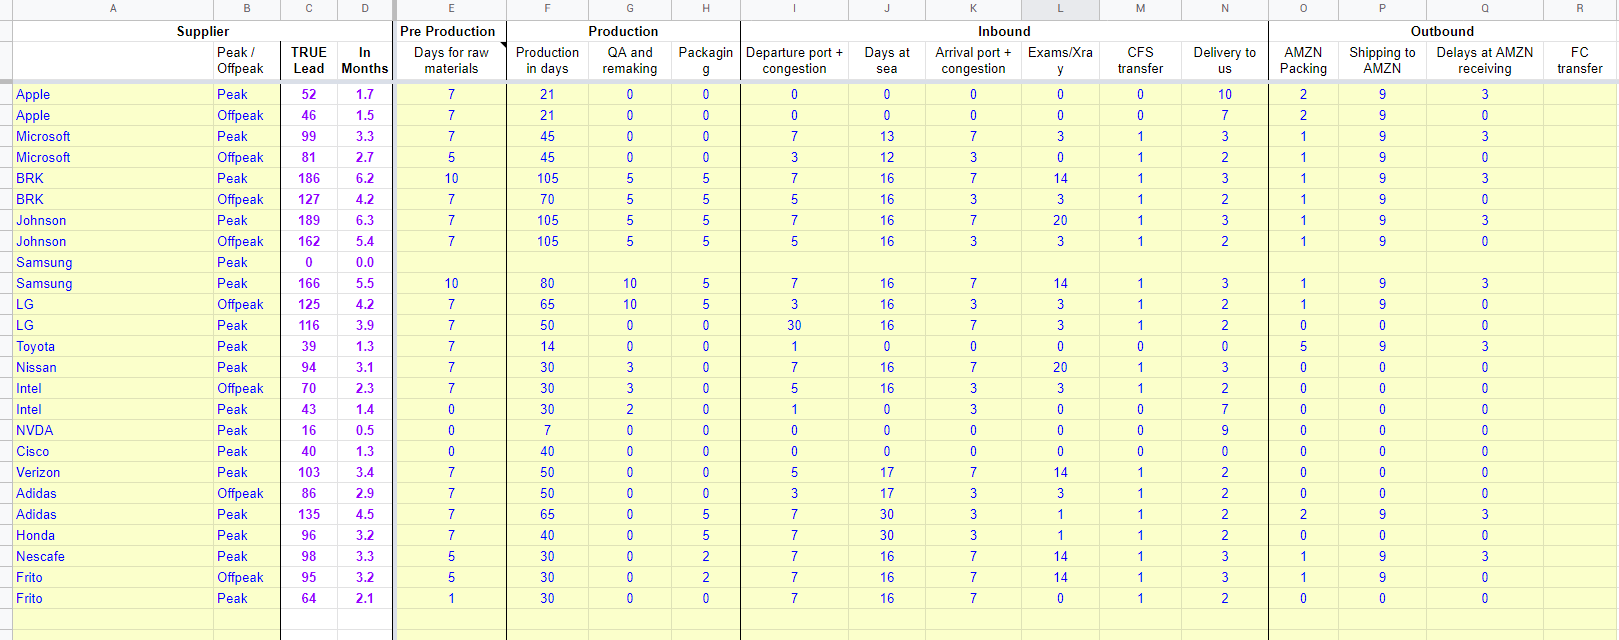
In a spreadsheet form, this is what your lead time calculation should be broken down into. A download link is provided at the bottom of the article.
Improve your velocity calculations
The first thing I said was that lead times and inventory management go hand-in-hand.
You can’t have one, and not the other.
This is where velocity calculations come into play.
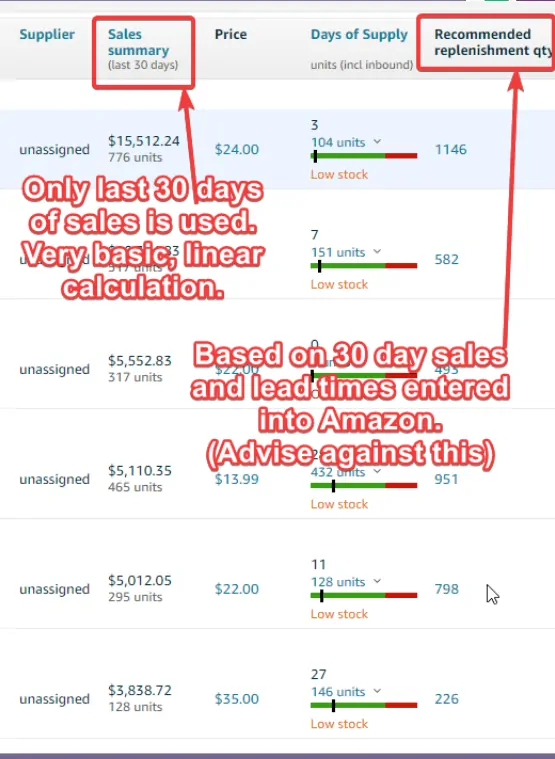
Amazon’s velocity calculation that most sellers depend on is very primitive and will leave you with serious inventory issues and high stock out rates.
This is because Amazon calculates velocity using the last 30 day sales only. It is a simple linear calculation that does not factor in:
- your product launches
- outside Amazon promotions
- spikes
- out of stock time
Apply weights to factor in seasonality and spikes
Best practice is to use more than one time period of 30 days.
Use the following for best results.
- Last 7 Days
- Last 14 Days
- Last 30 Days
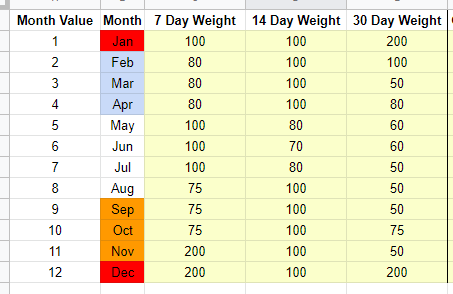
Then add a weighting factor for each month and time period.
- Helps with seasonality
- Helps with adjusting for spikes
- Helps to smoothen out the data
In my example, I have December as the best month. Therefore, the weights are higher. You can enter your own based on your own sales trends and seasonality.
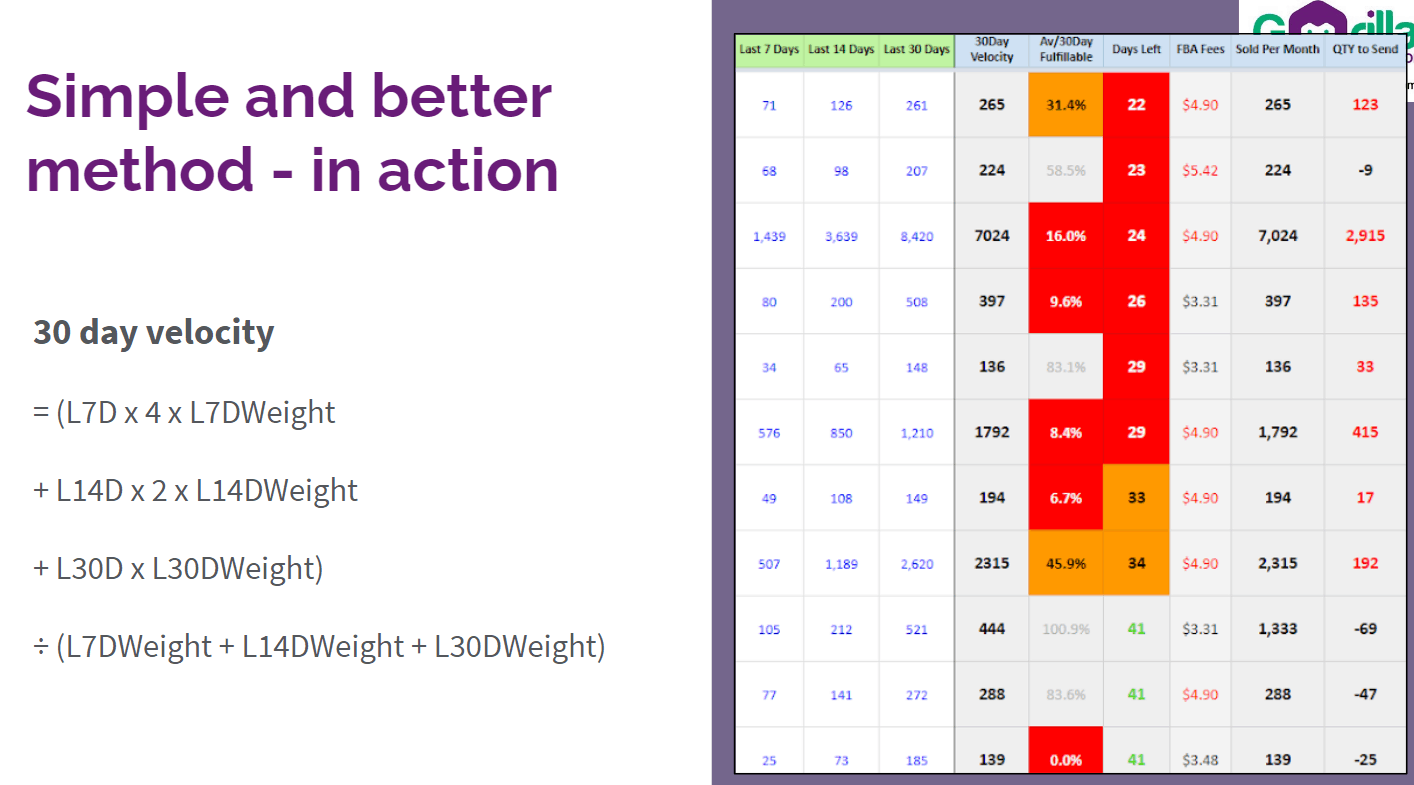
Using this data, you can now create a better velocity calculator which will feed into your lead time calculations and you get a better order lead time overview.
Enlarge the screenshot below to see how the last 7, 14, 30 days data is fed into the 30 day velocity.
This will help you to project your lead times and also factor in the true velocity of your sales.
How to automate the data and process
We have an Amazon Google Sheets Addon that automatically pulls this detailed data into your spreadsheet.
Full functionality and free for any 3 SKUs.
On any Google Sheet
- Menu > Add-ons > Get Add-ons
- Search “Gorilla Sheets for Amazon”
- Click Install
- Free user instructions
With the addon installed, you can do things like
=GORILLA_BUYBOXPRICE(A1:A100)
Displays the buy box price for SKU or ASIN listed in A1 to A100.
=GORILLA_SALESCOUNT("This Month", "ALL", A1:A100)
Gets the total number of units for SKU/ASIN listed in A1:A100 for this month across all marketplaces.
=GORILLA_REFUNDSCOUNT("This Year", "US", C1:C50)
Gets the total number of refunded units for SKU/ASIN listed in C1:C50 for this year in US.
=GORILLA_INVENTORY("B00YD5CC", "UK", "transfer")
Gets the total number of units under FC Transfer for the ASIN in UK.
Want more like fees, estimates, categories, reviews, lowest offers, ratings, historical data? All support and more.
Lead time and velocity slides
Free lead time calculator spreadsheet
More free calculators and spreadsheet resources
Comments
Related Posts
Smart Guide to Import Amazon Data to Google Sheets
Running an Amazon business means juggling dozens of moving parts:…
The ultimate guide to Shopify marketing attribution: what works best for your business?
What you’ll learn Have you ever wondered where your customers…
Top 5 Strategies to Sustainable Shopify Growth: Turning One-Time Buyers into Lifetime Customers
What you’ll learn As a Shopify seller, you’re constantly looking…




Leave a Reply