The numbers and information I share in these monthly updates are selective and for educational purposes as there are people I know personally who reads this. Keeping trade secrets and sensitive information under wraps of course.
The purpose of this monthly review is to organize my thoughts on the Amazon FBA side of things and reflect on the past month.
Article Summary (TL;DR)
✅ Learn about the strategies implemented to drive sales growth, including inventory management, pricing optimization, and marketing efforts.
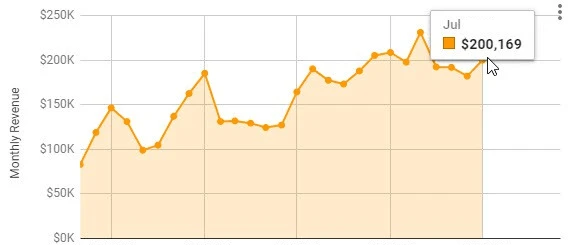
✅ Explore the performance metrics and milestones achieved in July for our FBA business, reaching $200K in sales.
✅ Gain insights into the challenges faced and lessons learned during the month, highlighting opportunities for improvement and future growth.
July FBA results

Prime day has come and gone and I’m sure everyone’s July has a bump thanks to it.
For the month, we ended up higher than last month at $200k. In July of last year, we did $165k. A 21% increase. Nice little jump but nothing huge.
On top of that, Amazon continues to get more competitive and expensive each year. The increase in competition means we have to spend more on ads and the higher tariffs cut into our bottom line.
Top line at 20% is nice, but the bottom line didn’t increase at the same rate.
Always something to work on right?
I didn’t list any products on Prime day actually. There were a couple of products that we were hoping to have listed and showed up on the list of eligible products, but for whatever reason, when I went to activate it the following week, the Prime day time frame disappeared.
The week following Prime day drops off, so no point in running any lightning deals during the summer.
In 2017 we were heavily doing lightning deals and was able to grow our organic rankings. Every week we were listing 5-6 different items. There was no limit on how many products you could run simultaneously.
But the new lightning deal only allows you to run one of your products at a single time.
No point in doing it now.
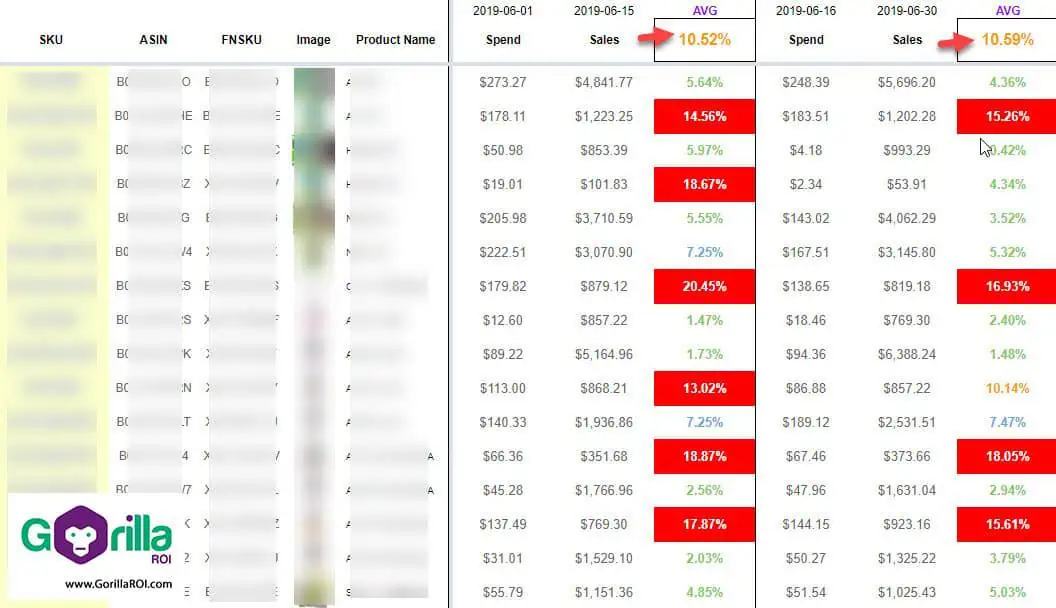
ACoS in June was 27.98%. This comes out to 11.2% of ad spend as a percentage of revenue.
I did a short interview last month on the topic of why I don’t focus on ACoS and why it’s not a good measure.
To summarize my points:
- Don’t focus on ACoS as it doesn’t give you a complete picture
- High ACoS could be a result of low visibility and low conversions. More visibility and higher conversion could bring it down.
- Low ACoS could mean you have a door open for the competition to walk through.
- Track your sku’s as a percentage of total sales (ppc sales + organic sales).
- Adjust your spend to get it to your desired range. For us, we want to keep it at 10% of total revenue. Just a tad above our mark, but it’s a big improvement compared to our Q1 where we were spending 13% of sales.
July Happenings

In this section, I can talk more small business related stuff other than Amazon.
July was stressful, and it’s rolling over to August.
We changed insurance companies to increase our liability coverage, but shortly after signing and getting our new policy, we received a letter stating they were going to cancel our policy because they didn’t want to insure anything related to personal care products that are applied to the skin.
We don’t do any in house manufacturing. We do contract manufacturing and all the products are under our name.
But we are still classified as manufacturers instead of distributors or wholesalers. That puts us on a different risk category with insurers and they don’t want to bother with a company our size.
We have to be doing at least $10M for them to even consider it.
That’s been the struggle at the moment.
I have one of the best brokers working for us and she has been knocking on every insurer, but no one is interested.
With our move coming up in a couple of months, it’s getting down to the wire. The new landlord is a REIT firm so they don’t care who you are. The management company is a fortune 500 company, so again, they don’t care.
Some struggles of operating as a small business.
It’s why I wrote that it’s better to stay small or go big. If you are small, you can contain operations and keep it lean to maximize margins.
If you get bigger, you get more leverage in other areas and can stand your ground.
If you are in the middle, you are in no man’s land.
Hiring and Firing
As our sales increase and more work and tasks need to be completed, looks like we need to keep outsourcing where possible and planning to hire.
We just fired our social media manager.
The results weren’t there based on how much we were paying. Doing a post-mortem analysis, I realize it’s hard to expect much results from an external person or agency that is handling too many accounts.
There’s no way they can handle work involved, let alone put in the time required to carve a strategy and implement it.
We were paying excessively for someone to just post a few times a week.
I’ll be hiring somebody or training an internal employee to do this inhouse which will be more effective and controllable.
This brings me to expanding the team. With our thin margins, there isn’t much room to hire aggressively. To stay lean, we have to outsource or hire VA’s to do the easier tasks.
The goal is to track all the work our main team does that is repetitive and easy to train. Then to outsource it so that we can focus on ROI generating and strategic projects.
Margins for July
Summer sales is slow, but can’t forget that Q4 is around the corner. Product planning and ordering is required.
We have people who sell our products in different states so keeping inventory on hand is important.
New products arrived finally so we had some big bills to pay. The worst was two of our products being tagged for intensive exams at customs.
Argh…
On a cash based accounting, gross came in at 16%.
Each time I write these reports, I realize how off we are as accrual accounting shows a different picture. But cash is the life cycle of the business and good to track.
Nevertheless, if we want to sell our business one day, accrual will make everything easier and smoother.
As mentioned above, the account ACoS for July was 27.9%. We jacked up the PPC for prime day, but the increased sales make it even out.
Wholesale and our online store
I’m not including our direct or wholesale sales in these numbers. Amazon makes up the majority percentage.
Free FBA spreadsheets for all
If you’re looking for free FBA spreadsheetsto help you run your numbers, you can get the templates for free.
You can download it immediately without having to sign up for anything.
Just copy straight to your account.
If you want to get updated data straight into your own Google sheets, you can use Gorilla ROI. Makes work so much easier when you don’t have to manually update data or log into accounts constantly and wasting time.
Comments
Related Posts
Mastering Shopify’s UTMs: The Simple Way to Smarter Marketing
Let’s be honest: marketing your Shopify store without tracking what’s…

10 Profitable Product Categories for Amazon Affiliates 2025
What you’ll learn Amazon is a favorite for experienced and…

Unlock the Secret to a Profitable Automated Amazon Store: How to Build a Hands-Free Income Stream
Ever dreamed of running a profitable Amazon business while sipping…


Leave a Reply